Introduction
This series of articles will give an overview of the Palette colorization mechanism of RadChartView.
The palette is a set of predefined Fills and Strokes which can be used to set the coloring of a chart much easier then setting explicitly the colors for each bar or slice. RadChartView brings you the options to define your own palettes and to use the ones we have prepared for you as well.
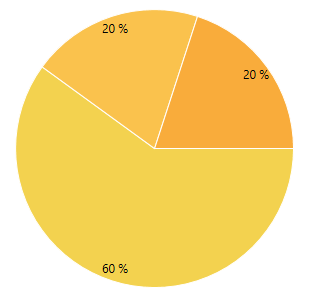
RadPieChart with Warm Pallete
<telerik:RadPieChart Palette="Warm">
    <telerik:PieSeries>
      <telerik:PieSeries.DataPoints/>
        <telerik:PieDataPoint Value="9" />
        <telerik:PieDataPoint Value="3" />
        <telerik:PieDataPoint Value="3" />
      </telerik:PieSeries.DataPoints>
    </telerik:PieSeries>
</telerik:RadPieChart>
Pie chart with the built-in Warm palette
The palette coloring is index based, which means that each next chart item (series or data point) will get the next palette entry from the palette collection. When the palette entries are exhausted, they will start repeating. For example, the built-in palettes have 8 colors defined. The first chart series will take the first palette color, the second series the second color, and so on. If you end up with, lets say, 9 series, the palette entries will start repeating and the first entry will be used for the 9th chart series.
By default the coloring is applied based on the series index, but few of the chart series (like BarSeries) allow you to change this behavior via their PaletteMode property.
Built In Palettes
Here are all of the predefined chart palettes:
| Name | Pallete |
|---|---|
| Arctic | |
| Autumn | |
| Cold | |
| Flower | |
| Forest | |
| Grayscale | |
| Ground | |
| Lilac | |
| Natural | |
| Pastel | |
| Rainbow | |
| Spring | |
| Summer | |
| Warm | |
| Windows8 | |
| Office2013 | |
| VisualStudio2013 | |
| Green | |
| Office2016 | |
| Material | |
| Fluent | |
| Crystal | |
| VisualStudio2019 | |
| Office2019 | |
| Windows11 |