Palette Entry
Each palette contains PaletteEntry objects which expose the following properties:
- Fill
- Stroke
- AdditionalFill
- AdditionalStroke
Fill and Stroke are the most commonly used properties which affect most of the series in RadChartView. AdditionalFill and AdditionalStroke are more specific and are not relevant for all types of series.
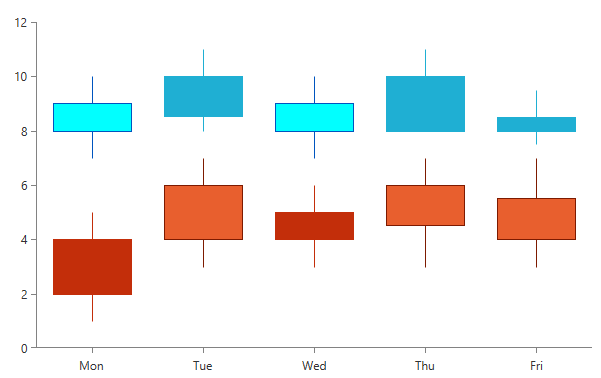
The AdditionalStroke property, for example, is relevant in the OhlcSeries, where the properties OpenBinding and CloseBinding define two types of sticks, depending on which of these properties has a bigger value. One of these types takes its color from Stroke and the other - from AdditionalStroke. Similarly, the AdditionalFill property affects the CandlestickSeries.
Example 1: Creating a custom palette
<telerik:RadCartesianChart>
    <telerik:RadCartesianChart.Palette>
        <telerik:ChartPalette>
            <telerik:ChartPalette.GlobalEntries>
                <telerik:PaletteEntry Fill="#FF1FAFD3" Stroke="#FF1FAFD3" AdditionalFill="#FF01FFFF" AdditionalStroke="#0055BF"/>
                <telerik:PaletteEntry Fill="#FFC32E0A" Stroke="#FFC32E0A" AdditionalFill="#FFE85F2E" AdditionalStroke="#7D1A00"/>
            </telerik:ChartPalette.GlobalEntries>
        </telerik:ChartPalette>
    </telerik:RadCartesianChart.Palette>

    <telerik:RadCartesianChart.HorizontalAxis>
        <telerik:CategoricalAxis/>
    </telerik:RadCartesianChart.HorizontalAxis>
    <telerik:RadCartesianChart.VerticalAxis>
        <telerik:LinearAxis/>
    </telerik:RadCartesianChart.VerticalAxis>

    <telerik:CandlestickSeries>
        <telerik:CandlestickSeries.DataPoints>
            <telerik:OhlcDataPoint Category="Mon" Open="9" High="10" Low="7" Close="8"/>
            <telerik:OhlcDataPoint Category="Tue" Open="8.5" High="11" Low="8" Close="10"/>
            <telerik:OhlcDataPoint Category="Wed" Open="9" High="10" Low="7" Close="8"/>
            <telerik:OhlcDataPoint Category="Thu" Open="8" High="11" Low="8" Close="10"/>
            <telerik:OhlcDataPoint Category="Fri" Open="8" High="9.5" Low="7.5" Close="8.5"/>
        </telerik:CandlestickSeries.DataPoints>
    </telerik:CandlestickSeries>

    <telerik:CandlestickSeries>
        <telerik:CandlestickSeries.DataPoints>
            <telerik:OhlcDataPoint Category="Mon" Low="1" High="5" Open="2" Close="4"/>
            <telerik:OhlcDataPoint Category="Tue" Low="3" High="7" Open="6" Close="4"/>
            <telerik:OhlcDataPoint Category="Wed" Low="3" High="6" Open="4" Close="5"/>
            <telerik:OhlcDataPoint Category="Thu" Low="3" High="7" Open="6" Close="4.5"/>
            <telerik:OhlcDataPoint Category="Fri" Low="3" High="7" Open="5.5" Close="4"/>
        </telerik:CandlestickSeries.DataPoints>
    </telerik:CandlestickSeries>
</telerik:RadCartesianChart>
Figure 1: OhlcSeries with Custom Palette

Getting a PaletteEntry of a Series
You can get the PaletteEntry of a series using the Palette property of the chart through its GetEntry method.
When you are working with BarSeries with its property PaletteMode set to DataPoint you can also get the PaletteEntry per data point.
Example 2: Getting the palette entry of a series
int index = chart.Series.IndexOf(series);
PaletteEntry? paletteEntry = this.chart.Palette.GetEntry(series, index);
Dim index As Integer = chart.Series.IndexOf(series)
Dim paletteEntry As System.Nullable(Of PaletteEntry) = Me.chart.Palette.GetEntry(series, index)