Custom Smart Label Strategy
The chart's smart labels feature tries to positions the labels of the data points in such a way that they do not overlap one another. To customize this behavior and implement custom smart labels startegy you can use create a class that derives from ChartSmartLabelsStrategyBase and override its CalculateLabelsPositions method.
Example 1: Defininig custom smart label strategy class
public class CustomSmartLabelStrategy: ChartSmartLabelsStrategyBase
{
    protected override void CalculateLabelsPositions(RadRect plotAreaClip, ReadOnlyCollection<ChartSeriesLabelPositionInfo> labelPositionInfos)
    {
        base.CalculateLabelsPositions(plotAreaClip, labelPositionInfos);
    }
}
Creating Custom Smart Label Strategy
This section will walk you through the creation of a custom smart label strategy. First, we will specify the following view models which are going to be used to populate the chart control.
Example 1: Defining view models
public class PlotInfo
{
    public string XCat { get; set; }
    public double YVal { get; set; }
}
public class MainViewModel
{
    public ObservableCollection<PlotInfo> Data { get; set; }
    Random rnd = new Random();
    public MainViewModel()
    {
        Data = new ObservableCollection<PlotInfo>();
        for (int i = 0; i < 100; i++)
        {
            PlotInfo dataPoint = new PlotInfo();
            dataPoint.Category = "x" + i;
            dataPoint.Value = rnd.Next(20, 50);
            Data.Add(dataPoint);
        }
    }
}
In order to visualize the connections between the labels and the corresponding data points, you can take advantage of the LabelConnectorsSettings property of the chart series.
Example 2: Defining RadCartesianChart in XAML
<telerik:RadCartesianChart x:Name="chart" ClipToBounds="False">
    <telerik:RadCartesianChart.SmartLabelsStrategy>
        <local:TwoLineSeriesLabelsStrategy/>
    </telerik:RadCartesianChart.SmartLabelsStrategy>
    <telerik:RadCartesianChart.HorizontalAxis>
        <telerik:CategoricalAxis SmartLabelsMode="SmartStep"/>
    </telerik:RadCartesianChart.HorizontalAxis>
    <telerik:RadCartesianChart.VerticalAxis>
        <telerik:LinearAxis />
    </telerik:RadCartesianChart.VerticalAxis>
    <telerik:RadCartesianChart.Series>
        <telerik:LineSeries CategoryBinding="Category" ValueBinding="Value" ItemsSource="{Binding Data}" ShowLabels="True" ClipToPlotArea="False">
            <telerik:LineSeries.LabelDefinitions>
                <telerik:ChartSeriesLabelDefinition HorizontalAlignment="Center" VerticalAlignment="Center" >
                    <telerik:ChartSeriesLabelDefinition.Template>
                        <DataTemplate>
                            <Border BorderBrush="Black" Background="Bisque" BorderThickness="1">
                                <TextBlock Foreground="DarkBlue" Text="{Binding DataItem.Value}" />
                            </Border>
                        </DataTemplate>
                    </telerik:ChartSeriesLabelDefinition.Template>
                </telerik:ChartSeriesLabelDefinition>
            </telerik:LineSeries.LabelDefinitions>
            <telerik:LineSeries.LabelConnectorsSettings>
                <telerik:ChartSeriesLabelConnectorsSettings />
            </telerik:LineSeries.LabelConnectorsSettings>
        </telerik:LineSeries>
    </telerik:RadCartesianChart.Series>
</telerik:RadCartesianChart>
Example 3: Defining RadCartesianChart in XAML
public partial class MainWindow : Window
{
    public MainWindow()
    {
        InitializeComponent();
        this.DataContext = new MainViewModel();
    }
}
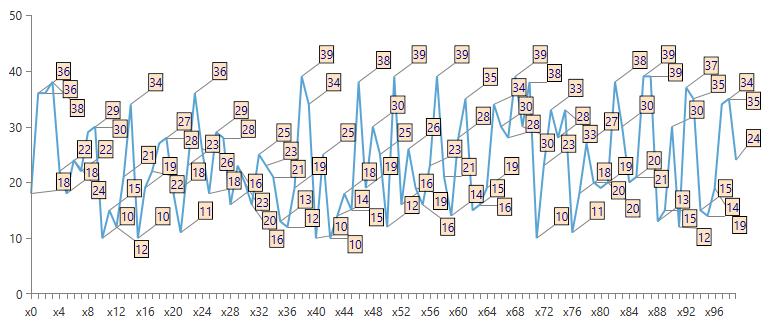
Figure 1: Labels without Custom Smart Label Strategy
Looking at the Figure 1 you can easily observe that some of the labes are overlapped and it is not clear enough which label for which data point corresponds. To change the position of the label we can create custom label strategy. To do that we will need to create a custom class which inherits ChartSmartLabelsStrategyBase. You can use this class to control the positioning of the labels. The arranging of the labels is happening in the CalculateLabelsPositions() method.
Example 4: Creating custom ChartSmartLabelsStrategyBase
public class CustomSmartLabelStrategy : ChartSmartLabelsStrategyBase
{
    protected override void CalculateLabelsPositions(RadRect plotAreaClip, ReadOnlyCollection<ChartSeriesLabelPositionInfo> labelPositionInfos)
    {
        if (labelPositionInfos.Count == 0)
        {
            return;
        }

        LineSeries firstSeries = labelPositionInfos[0].DataPoint.Presenter as LineSeries;

        for (int i = 0; i < labelPositionInfos.Count; i++)
        {
            var label = labelPositionInfos[i];
            int index = label.DataPoint.CollectionIndex;

            RadRect finalSlot = label.DefaultLayoutSlot;
            foreach (RadRect slot in GetSlots(label.DataPoint.LayoutSlot, label.DefaultLayoutSlot, plotAreaClip))
            {
                finalSlot = AlignToPlotArea(slot, plotAreaClip);
                if (!IntersectsPreviousLabels(finalSlot, labelPositionInfos, i) && !IntersectsPointMarks(finalSlot, labelPositionInfos))
                {
                    break;
                }
            }
            if (i + 1 == labelPositionInfos.Count)
            {
                finalSlot.X -= 40;
                finalSlot.Y += 20;
                labelPositionInfos[i].FinalLayoutSlot = finalSlot;
            }
            else
            {
                labelPositionInfos[i].FinalLayoutSlot = finalSlot;
            }
        }
    }

    private static RadRect AlignToPlotArea(RadRect slot, RadRect plotAreaClip)
    {
        slot.X = Math.Min(slot.X, plotAreaClip.Right - slot.Width);
        slot.X = Math.Max(slot.X, plotAreaClip.X);
        slot.Y = Math.Min(slot.Y, plotAreaClip.Bottom - slot.Height);
        slot.Y = Math.Max(slot.Y, plotAreaClip.Y);
        slot.Y -= 10;
        slot.X += 25;
        return slot;
    }

    private bool IntersectsPreviousLabels(RadRect slot, ReadOnlyCollection<ChartSeriesLabelPositionInfo> labelPositionInfos, int index)
    {
        for (int i = index - 1; i >= 0; i--)
        {
            if (slot.IntersectsWith(labelPositionInfos[i].FinalLayoutSlot))
                return true;
        }
        return false;
    }

    private bool IntersectsPointMarks(RadRect slot, ReadOnlyCollection<ChartSeriesLabelPositionInfo> labelPositionInfos)
    {
        for (int i = 0; i < labelPositionInfos.Count; i++)
        {
            RadRect pointMark = labelPositionInfos[i].DataPoint.LayoutSlot;
            pointMark.Width = Math.Max(1, pointMark.Width);
            pointMark.Height = Math.Max(1, pointMark.Width);

            if (slot.IntersectsWith(pointMark))
                return true;
        }
        return false;
    }

    private IEnumerable<RadRect> GetSlots(RadRect pointMark, RadRect label, RadRect plotAreaClip)
    {
        double offset = -label.Height - 3;
        int step = 1;

        for (int i = 0; ; i++)
        {
            double top = pointMark.Center.Y + offset + (i * step);
            if (top > plotAreaClip.Bottom || top < plotAreaClip.Y)
            {
                break;
            }

            yield return new RadRect(pointMark.Center.X - (label.Width / 2), top, label.Width, label.Height);
        }

        for (int i = 0; ; i++)
        {
            double top = pointMark.Center.Y + offset - (-i * step);
            if (top > plotAreaClip.Bottom || top < plotAreaClip.Y)
            {
                break;
            }

            yield return new RadRect(pointMark.Center.X - (label.Width / 2), top, label.Width, label.Height);
        }
        yield return label;
    }
}
Example 4: Setting the CustomSmartLabelStrategy
public partial class MainWindow : Window
{
    public MainWindow()
    {
        InitializeComponent();
        this.DataContext = new MainViewModel();
        this.chart.SmartLabelsStrategy = new CustomSmartLabelStrategy();
    }
}
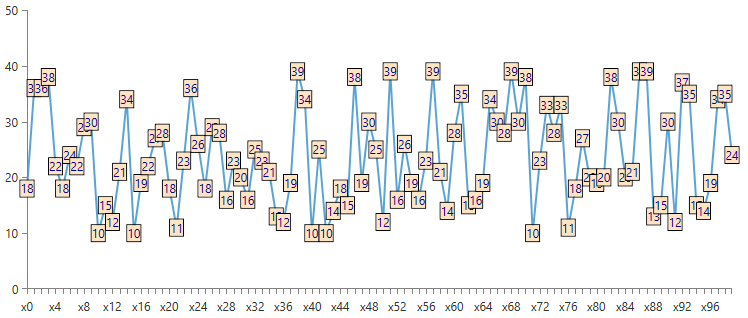
Figure 1: Labels with Custom Smart Label Strategy