Smart Labels
Since the official Q1 2014 release all series exposed by the RadCartesianChart and the RadPieChart controls support smart labels. The term "smart labels" refers to labels positioned in such a way that they do not overlap one another. This positioning strategy is helpful when the series has large number of data points with visualized labels. You can take advantage of this functionality through the SmartLabelsStrategy property of the charting components. It is of type ChartSmartLabelsStrategyBase and gets or sets the object that controls the positioning of the labels.
Using Smart Labels in RadCartesianChart
In order to enable a smart label strategy in a RadCartesianChart you can utilize the ChartSmartLabelsStrategy.
 <telerik:RadCartesianChart.SmartLabelsStrategy>
      <telerik:ChartSmartLabelsStrategy />
  </telerik:RadCartesianChart.SmartLabelsStrategy>
Let's say that you have line series with large number of data points and visualized labels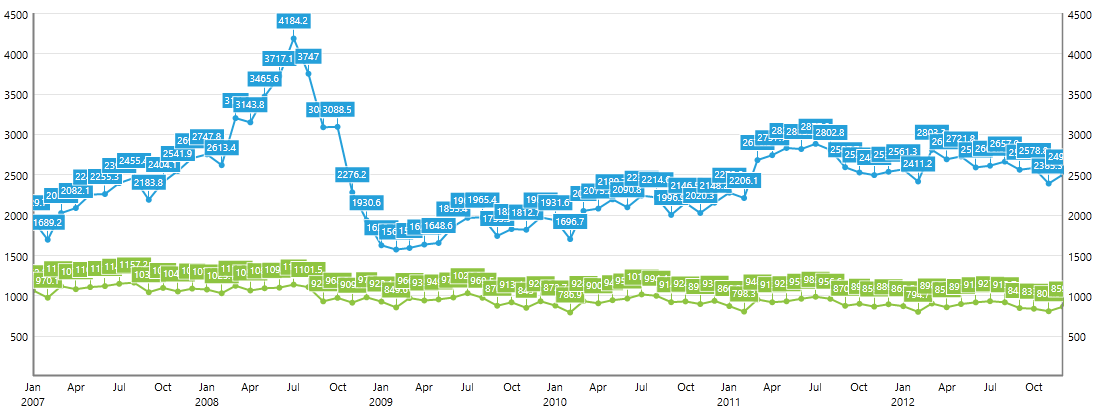
As you can see the labels are hard to read in such cases. The smart label strategy is designed to improve the readability of the labels. Once enabled, the labels will be rearranged so that each label is clearly visible.
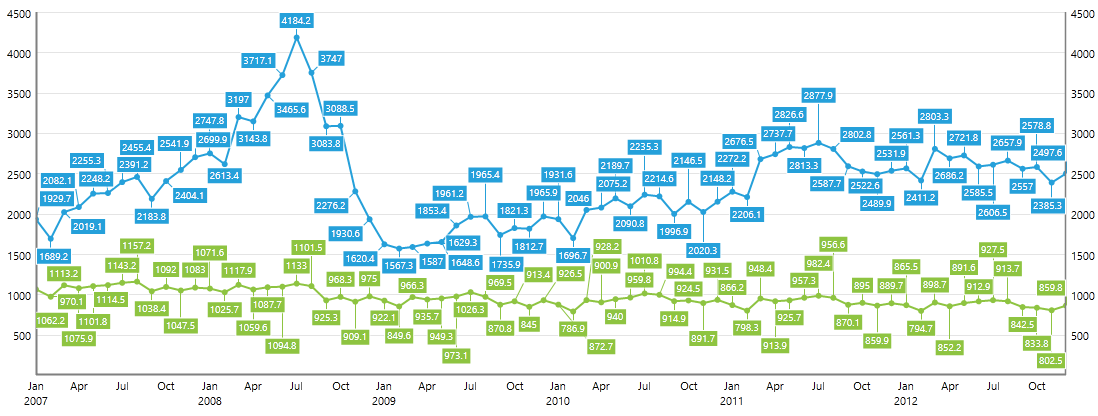
You can find this feature demonstrated in our online SmartLabels demo.
Using Smart Labels in RadPieChart
In order to enable a smart label strategy in a RadPieChart you can utilize the PieChartSmartLabelsStrategy.
<telerik:RadPieChart.SmartLabelsStrategy>
  <telerik:PieChartSmartLabelsStrategy/>
</telerik:RadPieChart.SmartLabelsStrategy>
Let's say that you have PieSeries with small slices and visualized labels
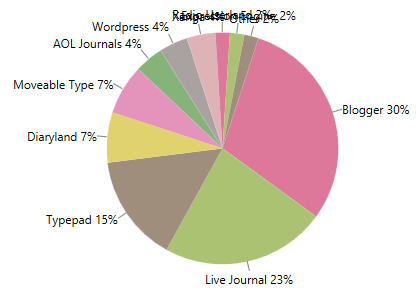
This smart labels strategy exposes the DisplayMode property. It is an enumeration of type PieChartLabelsDisplayMode and adjusts the positioning algorithm of the labels. It provides the following members:
Basic - this is the default value and it positions the labels inside the PieSeries so that they do not overlap one another.
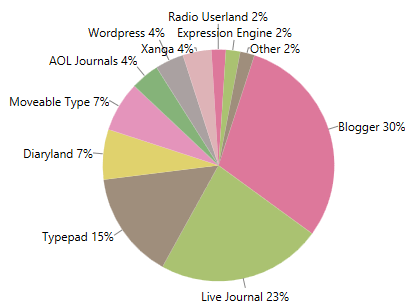
Outside - this value positions the labels outside the slices.
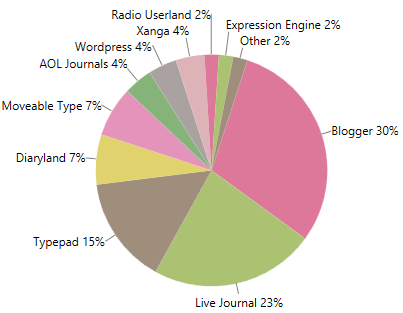
Spider - this value positions the labels outside the slices and aligns them by the first symbol of the labels.
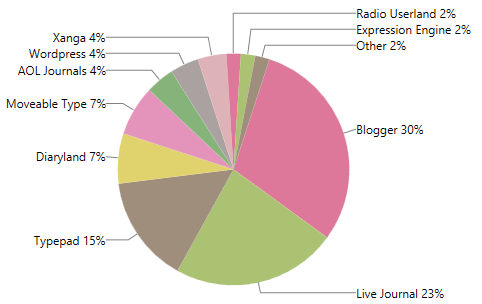
SpiderAlignedOutwards - this value positions the labels outside the slices and aligns them by the last symbol of the labels.
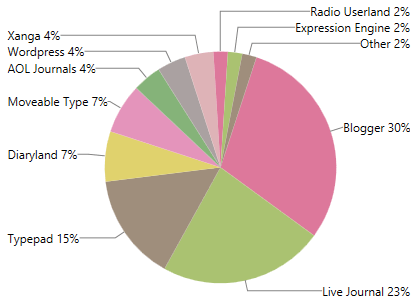
SpiderUnaligned - this value positions the labels outside the slices and does not align them.

In order to visualize the connections between the labels and the corresponding data points, you can take advantage of the LabelConnectorsSettings property of the chart series.