DateTime Support
Often charts are used to display information for certain period in time. RadChart provides full support of DateTime values and allows you to show dates on the X-Axis.
You can populate your chart with DateTime values by using SeriesMapping or DataPoints. Take a look at the Populating with Data topic for more details.
Using data binding (SeriesMapping/ItemMapping)
On the example below, RadChart.ItemSource is set to a collection of TradeData object. TradeData has the following definition:
public class TradeData
{
    //...
    public DateTime FromDate { get; set; }
    public double Close { get; set; }
    //...
}
Public Class TradeData
    '....'
    Private _FromDate As DateTime
    Public Property FromDate() As DateTime
        Get
            Return _FromDate
        End Get
        Set(ByVal value As DateTime)
            _FromDate = value
        End Set
    End Property

    Private _Close As Double
    Public Property Close() As Double
        Get
            Return _Close
        End Get
        Set(ByVal value As Double)
            _Close = value
        End Set
    End Property
    '....'
End Class
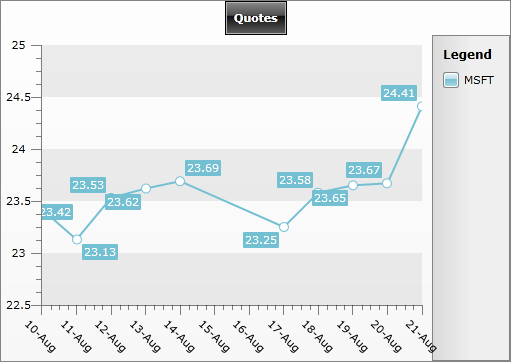
Now, you have to bind the TradeData.FromDate to DataPointMember.XValue and TradeDate.Close to DataPointMember.YValue using SeriesMapping/ItemMapping mechanism. Additionally, the X-Axis is customized: the values are formatted (radChart.DefaultView.ChartArea.AxisX.DefaultLabelFormat = "dd-MMM") and rotated on 45 degree (radChart.DefaultView.ChartArea.AxisX.LabelRotatingAngle = 45):
<telerik:RadChart x:Name="radChart"
                  Width="511"
                  Height="362"
                  VerticalAlignment="Top">
    <telerik:RadChart.SeriesMappings>
        <telerik:SeriesMapping LegendLabel="MSFT">
            <telerik:SeriesMapping.SeriesDefinition>
                <telerik:LineSeriesDefinition ShowItemLabels="False" />
            </telerik:SeriesMapping.SeriesDefinition>

            <telerik:SeriesMapping.ItemMappings>
                <telerik:ItemMapping DataPointMember="XValue" FieldName="FromDate" />
                <telerik:ItemMapping DataPointMember="YValue" FieldName="Close" />
            </telerik:SeriesMapping.ItemMappings>
        </telerik:SeriesMapping>
    </telerik:RadChart.SeriesMappings>
    <telerik:RadChart.DefaultView>
        <telerik:ChartDefaultView>
            <!--  ....  -->
            <telerik:ChartDefaultView.ChartArea>
                <telerik:ChartArea LegendName="chartLegend">
                    <telerik:ChartArea.AxisX>
                        <telerik:AxisX DefaultLabelFormat="dd-MMM" LabelRotationAngle="45" />

                    </telerik:ChartArea.AxisX>
                </telerik:ChartArea>
            </telerik:ChartDefaultView.ChartArea>
        </telerik:ChartDefaultView>
    </telerik:RadChart.DefaultView>
</telerik:RadChart>
Telerik.Windows.Controls.RadChart radChart = new Telerik.Windows.Controls.RadChart();
SeriesMapping seriesMapping = new SeriesMapping();
seriesMapping.LegendLabel = "MSFT";
seriesMapping.SeriesDefinition = new LineSeriesDefinition();
seriesMapping.ItemMappings.Add(new ItemMapping("FromDate", DataPointMember.XValue));
seriesMapping.ItemMappings.Add(new ItemMapping("Close", DataPointMember.YValue));
radChart.SeriesMappings.Add(seriesMapping);
radChart.DefaultView.ChartArea.AxisX.DefaultLabelFormat = "dd-MMM";
radChart.DefaultView.ChartArea.AxisX.LabelRotationAngle = 45;
Dim radChart As New Telerik.Windows.Controls.RadChart()
Dim seriesMapping As New SeriesMapping()
seriesMapping.LegendLabel = "MSFT"
seriesMapping.SeriesDefinition = New LineSeriesDefinition()
seriesMapping.ItemMappings.Add(New ItemMapping("FromDate", DataPointMember.XValue))
seriesMapping.ItemMappings.Add(New ItemMapping("Close", DataPointMember.YValue))
radChart.SeriesMappings.Add(seriesMapping)
radChart.DefaultView.ChartArea.AxisX.DefaultLabelFormat = "dd-MMM"
radChart.DefaultView.ChartArea.AxisX.LabelRotationAngle = 45
As a result, the chart will look like the one on the snapshot:
Using DataPoint
This example uses data binding mechanism via SeriesMapping/ItemMapping. However, using DataPoints is also possible, but you have to be aware of the following specifics:
DataPoint.XValue is of type double. Therefore, the DateTime values have to be converted to OLE Automation dates first: see DateTime.ToOADate().
The AxisX.IsDateTime should be set to True.
<telerik:RadChart Width="511"
                  Height="362"
                  HorizontalAlignment="Right"
                  VerticalAlignment="Top">
    <telerik:RadChart.DefaultView>
        <telerik:ChartDefaultView>
            <!--  ...  -->
            <telerik:ChartDefaultView.ChartArea>
                <telerik:ChartArea Margin="0, 0, 5, 0">
                    <telerik:ChartArea.AxisX>
                        <telerik:AxisX DefaultLabelFormat="dd-MMM"
                                       IsDateTime="True"
                                       LabelRotationAngle="45"
                                       LayoutMode="Inside" />

                    </telerik:ChartArea.AxisX>
                    <!--  ....  -->
                    <telerik:ChartArea.DataSeries>
                        <!--  Line Chart  -->
                        <telerik:DataSeries>
                            <telerik:DataSeries.Definition>
                                <telerik:LineSeriesDefinition />

                            </telerik:DataSeries.Definition>
                            <telerik:DataPoint XValue="39844.0" YValue="154" />
                            <telerik:DataPoint XValue="39872.0" YValue="138" />
                            <telerik:DataPoint XValue="39903.0" YValue="143" />
                            <telerik:DataPoint XValue="39933.0" YValue="120" />
                            <telerik:DataPoint XValue="39964.0" YValue="135" />
                            <telerik:DataPoint XValue="39994.0" YValue="125" />
                            <telerik:DataPoint XValue="40025.0" YValue="179" />
                            <telerik:DataPoint XValue="40056.0" YValue="170" />
                            <telerik:DataPoint XValue="40086.0" YValue="198" />
                            <telerik:DataPoint XValue="40117.0" YValue="187" />
                            <telerik:DataPoint XValue="40147.0" YValue="193" />
                            <telerik:DataPoint XValue="40178.0" YValue="176" />
                        </telerik:DataSeries>
                    </telerik:ChartArea.DataSeries>
                </telerik:ChartArea>
            </telerik:ChartDefaultView.ChartArea>
        </telerik:ChartDefaultView>
    </telerik:RadChart.DefaultView>
</telerik:RadChart>
Telerik.Windows.Controls.RadChart radChart = new Telerik.Windows.Controls.RadChart();
//....
radChart.DefaultView.ChartArea.AxisX.IsDateTime = true;
radChart.DefaultView.ChartArea.AxisX.LayoutMode = AxisLayoutMode.Inside;
radChart.DefaultView.ChartArea.AxisX.LabelRotationAngle = 45;
radChart.DefaultView.ChartArea.AxisX.DefaultLabelFormat = "dd-MMM";
//....
DataSeries lineSeries = new DataSeries();
lineSeries.Definition = new LineSeriesDefinition();
lineSeries.Add( new DataPoint() { YValue = 154, XValue = new DateTime( 2009, 1, 31 ).ToOADate() } );
lineSeries.Add( new DataPoint() { YValue = 138, XValue = new DateTime( 2009, 2, 28 ).ToOADate() } );
lineSeries.Add( new DataPoint() { YValue = 143, XValue = new DateTime( 2009, 3, 31 ).ToOADate() } );
lineSeries.Add( new DataPoint() { YValue = 120, XValue = new DateTime( 2009, 4, 30 ).ToOADate() } );
lineSeries.Add( new DataPoint() { YValue = 135, XValue = new DateTime( 2009, 5, 31 ).ToOADate() } );
lineSeries.Add( new DataPoint() { YValue = 125, XValue = new DateTime( 2009, 6, 30 ).ToOADate() } );
lineSeries.Add( new DataPoint() { YValue = 179, XValue = new DateTime( 2009, 7, 31 ).ToOADate() } );
lineSeries.Add( new DataPoint() { YValue = 170, XValue = new DateTime( 2009, 8, 31 ).ToOADate() } );
lineSeries.Add( new DataPoint() { YValue = 198, XValue = new DateTime( 2009, 9, 30 ).ToOADate() } );
lineSeries.Add( new DataPoint() { YValue = 187, XValue = new DateTime( 2009, 10, 31 ).ToOADate() } );
lineSeries.Add( new DataPoint() { YValue = 193, XValue = new DateTime( 2009, 11, 30 ).ToOADate() } );
lineSeries.Add( new DataPoint() { YValue = 176, XValue = new DateTime( 2009, 12, 31 ).ToOADate() } );
radChart.DefaultView.ChartArea.DataSeries.Add( lineSeries );
Dim radChart As New Telerik.Windows.Controls.RadChart()
'....'
radChart.DefaultView.ChartArea.AxisX.IsDateTime = True
radChart.DefaultView.ChartArea.AxisX.LayoutMode = AxisLayoutMode.Inside
radChart.DefaultView.ChartArea.AxisX.LabelRotationAngle = 45
radChart.DefaultView.ChartArea.AxisX.DefaultLabelFormat = "dd-MMM"
'....'
Dim lineSeries As New DataSeries()
lineSeries.Definition = New LineSeriesDefinition()
lineSeries.Add(New DataPoint(New DateTime(2009, 1, 31).ToOADate(), 154))
lineSeries.Add(New DataPoint(New DateTime(2009, 2, 28).ToOADate(), 138))
lineSeries.Add(New DataPoint(New DateTime(2009, 3, 31).ToOADate(), 143))
lineSeries.Add(New DataPoint(New DateTime(2009, 4, 30).ToOADate(), 120))
lineSeries.Add(New DataPoint(New DateTime(2009, 5, 31).ToOADate(), 135))
lineSeries.Add(New DataPoint(New DateTime(2009, 6, 30).ToOADate(), 125))
lineSeries.Add(New DataPoint(New DateTime(2009, 7, 31).ToOADate(), 179))
lineSeries.Add(New DataPoint(New DateTime(2009, 8, 31).ToOADate(), 170))
lineSeries.Add(New DataPoint(New DateTime(2009, 9, 30).ToOADate(), 198))
lineSeries.Add(New DataPoint(New DateTime(2009, 10, 31).ToOADate(), 187))
lineSeries.Add(New DataPoint(New DateTime(2009, 11, 30).ToOADate(), 193))
lineSeries.Add(New DataPoint(New DateTime(2009, 12, 31).ToOADate(), 176))
radChart.DefaultView.ChartArea.DataSeries.Add(lineSeries)
The image below shows the chart with defined using DataPoints:
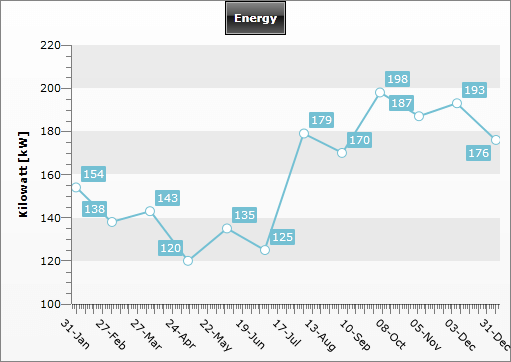
Note how the values are defined in the XAML - this is the OLE Automation equivalent of the dates. In the code behind, ToOADate() method is used to convert the dates and then the value is set to the XValue property of the DataPoint class.
The same logic is used when specifying the AxisX.MinValue and AxisX.MaxValue. This example also demonstrates how to customize the X-axis by disabling AutoRange and how to configure the axis manually.