Stacked Series
Stacked Column and Bar series in the ASP NET AJAX Chart can be clustered in groups since the Q3 2013 release.
Series that will be stacked in a separate group must have the same group name set in their GroupName property. If you leave the GroupName property blank, all series will be placed in one default stack. Setting the GroupName property of any series automatically sets the Stacked property of the first series to true, so it is not required to be explicitly set.
Example 1: Shows the markup code used to create Figure 1, which demonstrates a stacked column series.
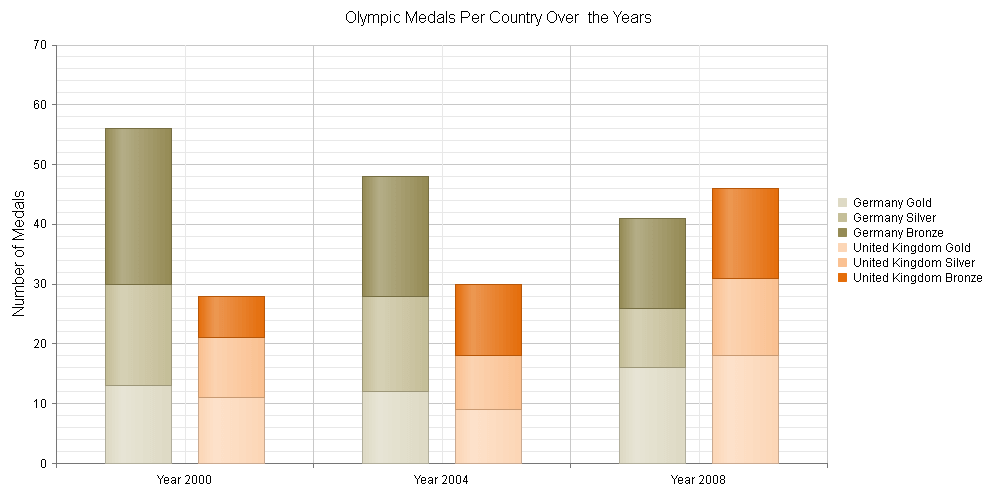
You can create Figure 1 using the markup in Example 1.
Example 1: Shows an implementation of chart with stacked columns.
<telerik:RadHtmlChart runat="server" ID="RadHtmlChart1" Width="1000" Height="500">
    <PlotArea>
        <Series>
            <telerik:ColumnSeries Name="Germany Gold" GroupName="Germany">
                <Appearance>
                    <FillStyle BackgroundColor="#DDD9C3" />
                </Appearance>
                <SeriesItems>
                    <telerik:CategorySeriesItem Y="13" />
                    <telerik:CategorySeriesItem Y="12" />
                    <telerik:CategorySeriesItem Y="16" />
                </SeriesItems>
                <TooltipsAppearance ClientTemplate="#= series.name# medals: #= dataItem.value#" />
                <LabelsAppearance Visible="false"></LabelsAppearance>
            </telerik:ColumnSeries>
            <telerik:ColumnSeries Name="Germany Silver" GroupName="Germany">
                <Appearance>
                    <FillStyle BackgroundColor="#C4BD97" />
                </Appearance>
                <SeriesItems>
                    <telerik:CategorySeriesItem Y="17" />
                    <telerik:CategorySeriesItem Y="16" />
                    <telerik:CategorySeriesItem Y="10" />
                </SeriesItems>
                <TooltipsAppearance ClientTemplate="#= series.name# medals: #= dataItem.value#" />
                <LabelsAppearance Visible="false"></LabelsAppearance>
            </telerik:ColumnSeries>
            <telerik:ColumnSeries Name="Germany Bronze" GroupName="Germany">
                <Appearance>
                    <FillStyle BackgroundColor="#948A54" />
                </Appearance>
                <SeriesItems>
                    <telerik:CategorySeriesItem Y="26" />
                    <telerik:CategorySeriesItem Y="20" />
                    <telerik:CategorySeriesItem Y="15" />
                </SeriesItems>
                <TooltipsAppearance ClientTemplate="#= series.name# medals: #= dataItem.value#" Color="White" />
                <LabelsAppearance Visible="false"></LabelsAppearance>
            </telerik:ColumnSeries>
            <telerik:ColumnSeries Name="United Kingdom Gold" GroupName="United Kingdom">
                <Appearance>
                    <FillStyle BackgroundColor="#FCD5B5" />
                </Appearance>
                <SeriesItems>
                    <telerik:CategorySeriesItem Y="11" />
                    <telerik:CategorySeriesItem Y="9" />
                    <telerik:CategorySeriesItem Y="18" />
                </SeriesItems>
                <TooltipsAppearance ClientTemplate="#= series.name# medals: #= dataItem.value#" />
                <LabelsAppearance Visible="false"></LabelsAppearance>
            </telerik:ColumnSeries>
            <telerik:ColumnSeries Name="United Kingdom Silver" GroupName="United Kingdom">
                <Appearance>
                    <FillStyle BackgroundColor="#FAC090" />
                </Appearance>
                <SeriesItems>
                    <telerik:CategorySeriesItem Y="10" />
                    <telerik:CategorySeriesItem Y="9" />
                    <telerik:CategorySeriesItem Y="13" />
                </SeriesItems>
                <TooltipsAppearance ClientTemplate="#= series.name# medals: #= dataItem.value#" />
                <LabelsAppearance Visible="false"></LabelsAppearance>
            </telerik:ColumnSeries>
            <telerik:ColumnSeries Name="United Kingdom Bronze" GroupName="United Kingdom">
                <Appearance>
                    <FillStyle BackgroundColor="#E46C0A" />
                </Appearance>
                <SeriesItems>
                    <telerik:CategorySeriesItem Y="7" />
                    <telerik:CategorySeriesItem Y="12" />
                    <telerik:CategorySeriesItem Y="15" />
                </SeriesItems>
                <TooltipsAppearance ClientTemplate="#= series.name# medals: #= dataItem.value#" Color="White" />
                <LabelsAppearance Visible="false"></LabelsAppearance>
            </telerik:ColumnSeries>
        </Series>
        <YAxis>
            <TitleAppearance Text="Number of Medals" />
        </YAxis>
        <XAxis>
            <LabelsAppearance DataFormatString="Year {0}" />
            <Items>
                <telerik:AxisItem LabelText="2000" />
                <telerik:AxisItem LabelText="2004" />
                <telerik:AxisItem LabelText="2008" />
            </Items>
        </XAxis>
    </PlotArea>
    <ChartTitle Text="Olympic Medals Per Country Over the Years">
    </ChartTitle>
    <Legend>
        <Appearance Position="Right" />
    </Legend>
</telerik:RadHtmlChart>