Multiline Labels
You can split labels and titles in the ASP NET AJAX Chart into multiple lines by using the "\n" line feed character. This help article shows how to wrap labels and titles in a chart (Figure 1) with a small sample (Example 1). The multiline labels feature is available since Q3 2014. If you are using an older version of the suite, this page provides a workaround.
You can add line breaks in tooltips via the
<br />tag because tooltips in RadHtmlChart are rendered with simple HTML.
Figure 1: Wrapping text in chart labels and titles by using a line feed character ("\n").
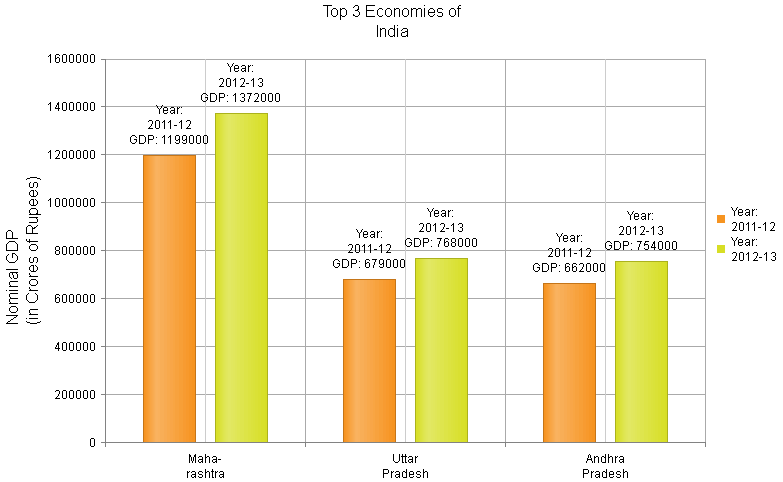
Example 1: How to split labels, titles and tooltips in RadHtmlChart into several lines. This code creates the chart shown in Figure 1.
<telerik:RadHtmlChart runat="server" ID="RadHtmlChart1" Width="800px" Height="500px">
    <ChartTitle Text="Top 3 Economies of \n India"></ChartTitle>
    <PlotArea>
        <Series>
            <telerik:ColumnSeries Name="Year:\n2011-12">
                <LabelsAppearance>
                    <ClientTemplate>
                    #=series.name#\n
                    GDP: #=value#
                    </ClientTemplate>
                </LabelsAppearance>
                <TooltipsAppearance>
                    <ClientTemplate>
                    #=series.name#<br />
                    GDP: #=value#<br />
                    State: #=category#
                    </ClientTemplate>
                </TooltipsAppearance>
                <SeriesItems>
                    <telerik:CategorySeriesItem Y="1199000" />
                    <telerik:CategorySeriesItem Y="679000" />
                    <telerik:CategorySeriesItem Y="662000" />
                </SeriesItems>
            </telerik:ColumnSeries>
            <telerik:ColumnSeries Name="Year:\n2012-13">
                <LabelsAppearance>
                    <ClientTemplate>
                    #=series.name#\n
                    GDP: #=value#
                    </ClientTemplate>
                </LabelsAppearance>
                <TooltipsAppearance>
                    <ClientTemplate>
                    #=series.name#<br />
                    GDP: #=value#<br />
                    State: #=category#
                    </ClientTemplate>
                </TooltipsAppearance>
                <SeriesItems>
                    <telerik:CategorySeriesItem Y="1372000" />
                    <telerik:CategorySeriesItem Y="768000" />
                    <telerik:CategorySeriesItem Y="754000" />
                </SeriesItems>
            </telerik:ColumnSeries>
        </Series>
        <XAxis>
            <Items>
                <telerik:AxisItem LabelText="Maha-\nrashtra" />
                <telerik:AxisItem LabelText="Uttar\nPradesh" />
                <telerik:AxisItem LabelText="Andhra\nPradesh" />
            </Items>
        </XAxis>
        <YAxis>
            <TitleAppearance Text="Nominal GDP\n(in Crores of Rupees)"></TitleAppearance>
            <MinorGridLines Visible="false" />
        </YAxis>
    </PlotArea>
</telerik:RadHtmlChart>
If you are setting these properties from the code-behind, you may need to escape the backslash as shown in Example 2 below. You can read more about this in the Handle Special Symbols article. This does not apply to the
[axis].LabelsAppearance.DateFormatswhose format strings are escaped by the .NETJavaScriptSerializer. The main axis label format string, client templates, data and other strings (such as titles) require escaping.As of R3 2018, escaping the back slash with more backslashes than necessary will result in the
\nstring being rendered instead of a new line. This is a feature that allows the\nstring to be present in texts. Example 2 below explains how this works.
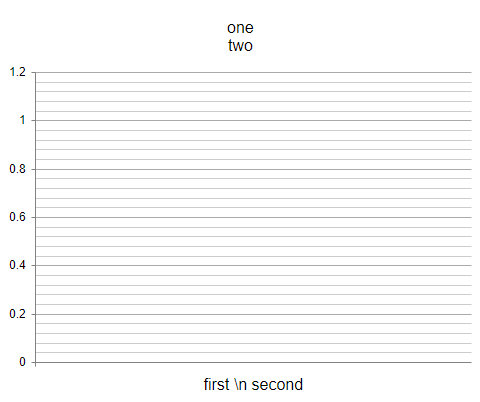
Example 2: How to escape new line characters from the code-behind. The result is shown in Figure 2.
//escape the new line character from the code-behind in C#
RadHtmlChart1.ChartTitle.Text = "one \\n two";

//as of R3 2018 this will not render a new line but a "\n" literal in the text
RadHtmlChart1.PlotArea.XAxis.TitleAppearance.Text = "first \\\\n second";
'in VB, the backslash is not a special symbol so it will not need additional escaping
RadHtmlChart1.ChartTitle.Text = "one \n two"

'as of R3 2018 this will not render a new line but a "\n" literal in the text
RadHtmlChart1.PlotArea.XAxis.TitleAppearance.Text = "first \\n second"
Figure 2: The expected result of the escaping shown in Example 2, after R3 2018.