Data Navigation
This help article describes the Data Navigation functionality (added in the Q1 2014 release), that lets you zoom and scroll data over time in the ASP NET AJAX Chart and provides an example on how to configure it in Example 1.
Overview of RadHtmlChart Data Navigation Feature
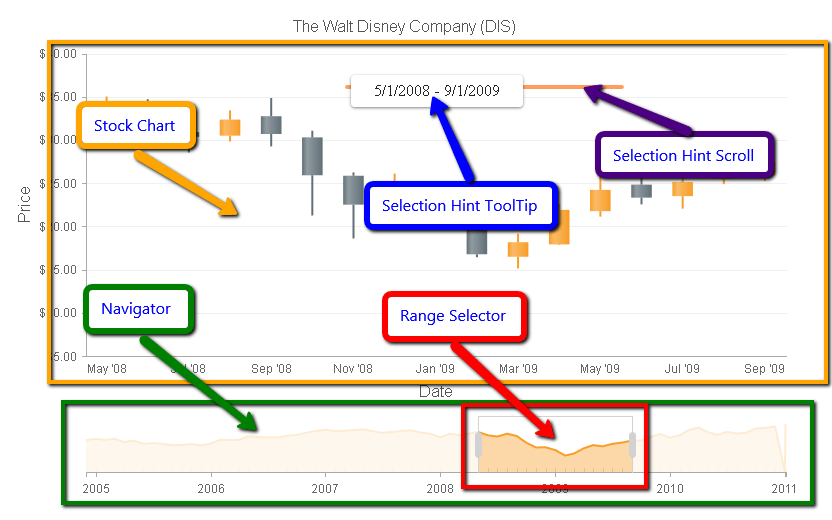
The Data Navigation functionality added as the Stock layout of a RadHtmlChart allows users to visualize data over time with the ability to zoom and scroll certain periods. As you can see in Figure 1, there aretwo main areas: the main chart (in the yellow box) and the navigator pane area (in the green box). The supported series types you can use in the main chart area and in the navigator include:
Data Navigation Element Structure
The Stock chart layout consists of two parts:
Main chart - Data from the selected time period is plotted in the main chart. A user can drag the plot area of the main chart to either side (left or right) in order to scroll to preceding or subsequent time intervals.While dragging, a tooltip in the upper part of the main chart called the Selection Hint shows the selected time interval.
Navigator pane - Located below the main chart, the navigator pane is a view that shows the trend of the full data. Users can use the navigator pane to select a desired time period through the Range Selector element. Users can drag the whole Range Selector element to the left or right side in order to scroll over the full data to a preceding or subsequent time frame.A user can also click and drag the left or right sides of the Range Selector to expand or collapse it from either side, which lets the user to zoom in/out the selected time interval.With each change of the selected range, the corresponding data will be plotted dynamically on the main chart (see Figure 1).
Figure 1: The visual elements in a stock chart layout.
An Example of Configuring a Stock Chart Layout with Data Navigation
The setup of a Stock chart layout with a Data Navigation requires that you:
-
Configure a main chart:
Instantiate a RadHtmlChart object and set its Layout property to "Stock".
Bind the chart to a data source that contains a DateTime field for the x-axis and use a numeric field for the y-axis.
Create a supported series type and configure it to load data for the y-axis throughthe corresponding properties (i.e., DataFieldY for Area, Column and Line series and DataOpenField, DataHighField, DataLowField, DataCloseField for Candlestick series).
Set the DataLabelsField property of the x-axis to the name of the DateTime field of the data source in order to distribute dates over the x-axis. You must either set the Type property of the x-axis to Date or don't set it ( i.e., Type="Date" is the default value when you pass DateTime values to the x-axis).
-
The format strings of the dates over the x-axis can be controlled for each BaseUnit (the x-axis' BaseUnit property of the main chart is automatically changed according to the Navigator pane's RangeSelector) through the XAxis.LabelsAppearance.DateFormats property which takes:
- SecondsFormat
- MinutesFormat
- HoursFormat
- DaysFormat
- WeeksFormat
- MonthsFormat
- YearsFormat
You can find the list with the standard and custom format strings that can be used in Format Dates help article.
-
Configure the Navigator pane:
- Add the Navigator tag in the chart.
- Create a supported series type in the Navigator and set its DataFieldY property to afield name of the data source used to load the data.
- Fine tune the Navigator (e.g., modify the appearance of the XAxis, choose a range for the RangeSelector, set a DataFormatString for the Selection Hint, etc.).
Example 1 shows how to create the chart shown in Figure 1.
Example 1: The code that creates a RadHtmlChart with a Data Navigation functionality, shown in Figure 1.
<telerik:RadHtmlChart runat="server" ID="RadHtmlChart1" Layout="Stock" Width="800" Height="500" Skin="Default">
    <Navigator Visible="true">
        <RangeSelector From="2008/05/01" To="2009/09/01" />
        <SelectionHint Visible="true" DataFormatString="From {0:d} to {1:d}" />
        <Series>
            <telerik:AreaSeries DataFieldY="DisneyClose">
            </telerik:AreaSeries>
        </Series>
        <XAxis Color="#aaaaaa">
            <LabelsAppearance>
                <TextStyle Color="#666666" />
            </LabelsAppearance>
        </XAxis>
    </Navigator>
    <PlotArea>
        <Series>
            <telerik:CandlestickSeries Name="Disney" DataOpenField="DisneyOpen" DataHighField="DisneyHigh" DataLowField="DisneyLow" DataCloseField="DisneyClose">
            </telerik:CandlestickSeries>
        </Series>
        <XAxis DataLabelsField="DisneyDate" Type="Date">
            <MajorGridLines Visible="false"></MajorGridLines>
            <MinorGridLines Visible="false"></MinorGridLines>
            <TitleAppearance Text="Date">
            </TitleAppearance>
        </XAxis>
        <YAxis>
            <LabelsAppearance DataFormatString="{0:C}">
            </LabelsAppearance>
            <MajorGridLines Visible="true" Color="#efefef" Width="1"></MajorGridLines>
            <MinorGridLines Visible="false"></MinorGridLines>
            <TitleAppearance Text="Price">
            </TitleAppearance>
        </YAxis>
    </PlotArea>
    <ChartTitle Text="The Walt Disney Company (DIS)">
    </ChartTitle>
</telerik:RadHtmlChart>
protected void Page_Load(object sender, EventArgs e)
{
    RadHtmlChart1.DataSource = GetData();
    RadHtmlChart1.DataBind();
}

protected DataTable GetData()
{
    DataTable dt = new DataTable();

    dt.Columns.Add("ID", typeof(int));
    dt.Columns.Add("DisneyDate", typeof(DateTime));
    dt.Columns.Add("DisneyOpen", typeof(float));
    dt.Columns.Add("DisneyHigh", typeof(float));
    dt.Columns.Add("DisneyLow", typeof(float));
    dt.Columns.Add("DisneyClose", typeof(float));

    dt.Rows.Add(0, new DateTime(2011, 1, 3), 37.74, 40, 37.62, 39.17);
    dt.Rows.Add(1, new DateTime(2010, 12, 1), 37.15, 37.99, 36.51, 37.51);
    dt.Rows.Add(2, new DateTime(2010, 11, 1), 36.21, 38, 35.15, 36.51);
    dt.Rows.Add(3, new DateTime(2010, 10, 1), 33.3, 36.52, 33.08, 36.13);
    dt.Rows.Add(4, new DateTime(2010, 9, 1), 33, 34.99, 32.68, 33.1);
    dt.Rows.Add(5, new DateTime(2010, 8, 2), 34.14, 35.41, 31.55, 32.54);
    dt.Rows.Add(6, new DateTime(2010, 7, 1), 31.47, 34.8, 30.72, 33.69);
    dt.Rows.Add(7, new DateTime(2010, 6, 1), 33.06, 35.83, 31.36, 31.5);
    dt.Rows.Add(8, new DateTime(2010, 5, 3), 36.95, 37.98, 31, 33.42);
    dt.Rows.Add(9, new DateTime(2010, 4, 1), 35.07, 37.49, 35.01, 36.84);
    dt.Rows.Add(10, new DateTime(2010, 3, 1), 31.4, 35.6, 31.34, 34.91);
    dt.Rows.Add(11, new DateTime(2010, 2, 1), 29.6, 31.52, 28.99, 31.24);
    dt.Rows.Add(12, new DateTime(2010, 1, 4), 32.5, 32.75, 28.71, 29.55);
    dt.Rows.Add(13, new DateTime(2009, 12, 1), 30.44, 32.75, 30.3, 32.25);
    dt.Rows.Add(14, new DateTime(2009, 11, 2), 27.38, 30.93, 27.01, 30.22);
    dt.Rows.Add(15, new DateTime(2009, 10, 1), 27.76, 29.98, 26.84, 27.37);
    dt.Rows.Add(16, new DateTime(2009, 9, 1), 25.89, 28.68, 25.25, 27.46);
    dt.Rows.Add(17, new DateTime(2009, 8, 3), 25.52, 27.3, 24.89, 26.04);
    dt.Rows.Add(18, new DateTime(2009, 7, 1), 23.5, 26.84, 22.05, 25.12);
    dt.Rows.Add(19, new DateTime(2009, 6, 1), 24.83, 25.64, 22.55, 23.33);
    dt.Rows.Add(20, new DateTime(2009, 5, 1), 21.76, 26.29, 21.12, 24.22);
    dt.Rows.Add(21, new DateTime(2009, 4, 1), 17.92, 22.57, 17.84, 21.9);
    dt.Rows.Add(22, new DateTime(2009, 3, 2), 16.48, 19.14, 15.14, 18.16);
    dt.Rows.Add(23, new DateTime(2009, 2, 2), 20.08, 20.79, 16.42, 16.77);
    dt.Rows.Add(24, new DateTime(2009, 1, 2), 22.76, 24.83, 19.95, 20.68);
    dt.Rows.Add(25, new DateTime(2008, 12, 1), 22.04, 26.1, 20.27, 22.69);
    dt.Rows.Add(26, new DateTime(2008, 11, 3), 25.85, 26.24, 18.6, 22.52);
    dt.Rows.Add(27, new DateTime(2008, 10, 1), 30.3, 31.06, 21.25, 25.91);
    dt.Rows.Add(28, new DateTime(2008, 9, 2), 32.74, 34.85, 29.25, 30.69);
    dt.Rows.Add(29, new DateTime(2008, 8, 1), 30.5, 33.42, 29.83, 32.35);
    dt.Rows.Add(30, new DateTime(2008, 7, 1), 30.91, 31.77, 28.55, 30.35);
    dt.Rows.Add(31, new DateTime(2008, 6, 2), 33.5, 34.71, 31.14, 31.2);
    dt.Rows.Add(32, new DateTime(2008, 5, 1), 32.45, 35.02, 32.42, 33.6);
    dt.Rows.Add(33, new DateTime(2008, 4, 1), 31.52, 33.03, 29.57, 32.43);
    dt.Rows.Add(34, new DateTime(2008, 3, 3), 32.61, 32.71, 30.05, 31.38);
    dt.Rows.Add(35, new DateTime(2008, 2, 1), 30.75, 33.23, 30.05, 32.41);
    dt.Rows.Add(36, new DateTime(2008, 1, 2), 32.32, 32.63, 26.3, 29.84);
    dt.Rows.Add(37, new DateTime(2007, 12, 3), 33.06, 33.5, 31.71, 32.28);
    dt.Rows.Add(38, new DateTime(2007, 11, 1), 34.51, 34.71, 30.68, 33.15);
    dt.Rows.Add(39, new DateTime(2007, 10, 1), 34.38, 35.69, 33.57, 34.63);
    dt.Rows.Add(40, new DateTime(2007, 9, 4), 33.51, 34.95, 33, 34.39);
    dt.Rows.Add(41, new DateTime(2007, 8, 1), 32.88, 34.93, 31.25, 33.6);
    dt.Rows.Add(42, new DateTime(2007, 7, 2), 34.38, 35.38, 32.99, 33);
    dt.Rows.Add(43, new DateTime(2007, 6, 1), 35.41, 35.89, 33, 34.14);
    dt.Rows.Add(44, new DateTime(2007, 5, 1), 35.09, 36.79, 35.09, 35.44);
    dt.Rows.Add(45, new DateTime(2007, 4, 2), 34.4, 35.47, 34.24, 34.98);
    dt.Rows.Add(46, new DateTime(2007, 3, 1), 33.73, 35.42, 33.28, 34.43);
    dt.Rows.Add(47, new DateTime(2007, 2, 1), 35.09, 36.09, 32.65, 34.25);
    dt.Rows.Add(48, new DateTime(2007, 1, 3), 34.21, 35.97, 33.95, 35.17);
    dt.Rows.Add(49, new DateTime(2006, 12, 1), 33.05, 34.89, 32.76, 34.27);
    dt.Rows.Add(50, new DateTime(2006, 11, 1), 31.55, 33.85, 31.39, 33.05);
    dt.Rows.Add(51, new DateTime(2006, 10, 2), 30.79, 31.99, 30.4, 31.46);
    dt.Rows.Add(52, new DateTime(2006, 9, 1), 29.82, 31.46, 29.3, 30.91);
    dt.Rows.Add(53, new DateTime(2006, 8, 1), 29.65, 30.12, 28.69, 29.65);
    dt.Rows.Add(54, new DateTime(2006, 7, 3), 30.19, 30.45, 28.15, 29.69);
    dt.Rows.Add(55, new DateTime(2006, 6, 1), 30.5, 31.03, 27.95, 30);
    dt.Rows.Add(56, new DateTime(2006, 5, 1), 28.01, 30.53, 27.63, 30.5);
    dt.Rows.Add(57, new DateTime(2006, 4, 3), 27.87, 28.25, 26.75, 27.96);
    dt.Rows.Add(58, new DateTime(2006, 3, 1), 28, 28.85, 27.06, 27.89);
    dt.Rows.Add(59, new DateTime(2006, 2, 1), 25.15, 28.49, 24.9, 27.99);
    dt.Rows.Add(60, new DateTime(2006, 1, 3), 24.08, 26.5, 23.77, 25.31);
    dt.Rows.Add(61, new DateTime(2005, 12, 1), 25.05, 25.7, 23.95, 23.97);
    dt.Rows.Add(62, new DateTime(2005, 11, 1), 24.28, 26.19, 24.28, 24.93);
    dt.Rows.Add(63, new DateTime(2005, 10, 3), 24.13, 25, 22.89, 24.37);
    dt.Rows.Add(64, new DateTime(2005, 9, 1), 25.09, 25.34, 22.9, 24.13);
    dt.Rows.Add(65, new DateTime(2005, 8, 1), 25.64, 26.47, 24.92, 25.19);
    dt.Rows.Add(66, new DateTime(2005, 7, 1), 25.22, 26.5, 24.35, 25.64);
    dt.Rows.Add(67, new DateTime(2005, 6, 1), 27.51, 27.99, 25.12, 25.18);
    dt.Rows.Add(68, new DateTime(2005, 5, 2), 26.57, 28.02, 26.02, 27.44);
    dt.Rows.Add(69, new DateTime(2005, 4, 1), 28.79, 29, 25.71, 26.4);
    dt.Rows.Add(70, new DateTime(2005, 3, 1), 27.97, 29, 27.47, 28.73);
    dt.Rows.Add(71, new DateTime(2005, 2, 1), 28.75, 29.99, 27.51, 27.94);
    dt.Rows.Add(72, new DateTime(2005, 1, 3), 27.81, 28.94, 27.05, 28.63);
    dt.Rows.Add(73, new DateTime(2004, 12, 1), 26.97, 28.03, 26.68, 27.8);

    return dt;
}
Protected Sub Page_Load(sender As Object, e As EventArgs) Handles Me.Load
    RadHtmlChart1.DataSource = GetData()
    RadHtmlChart1.DataBind()
End Sub

Protected Function GetData() As DataTable
    Dim dt As New DataTable()

    dt.Columns.Add("ID", GetType(Integer))
    dt.Columns.Add("DisneyDate", GetType(DateTime))
    dt.Columns.Add("DisneyOpen", GetType(Single))
    dt.Columns.Add("DisneyHigh", GetType(Single))
    dt.Columns.Add("DisneyLow", GetType(Single))
    dt.Columns.Add("DisneyClose", GetType(Single))

    dt.Rows.Add(0, New DateTime(2011, 1, 3), 37.74, 40, 37.62, 39.17)
    dt.Rows.Add(1, New DateTime(2010, 12, 1), 37.15, 37.99, 36.51, 37.51)
    dt.Rows.Add(2, New DateTime(2010, 11, 1), 36.21, 38, 35.15, 36.51)
    dt.Rows.Add(3, New DateTime(2010, 10, 1), 33.3, 36.52, 33.08, 36.13)
    dt.Rows.Add(4, New DateTime(2010, 9, 1), 33, 34.99, 32.68, 33.1)
    dt.Rows.Add(5, New DateTime(2010, 8, 2), 34.14, 35.41, 31.55, 32.54)
    dt.Rows.Add(6, New DateTime(2010, 7, 1), 31.47, 34.8, 30.72, 33.69)
    dt.Rows.Add(7, New DateTime(2010, 6, 1), 33.06, 35.83, 31.36, 31.5)
    dt.Rows.Add(8, New DateTime(2010, 5, 3), 36.95, 37.98, 31, 33.42)
    dt.Rows.Add(9, New DateTime(2010, 4, 1), 35.07, 37.49, 35.01, 36.84)
    dt.Rows.Add(10, New DateTime(2010, 3, 1), 31.4, 35.6, 31.34, 34.91)
    dt.Rows.Add(11, New DateTime(2010, 2, 1), 29.6, 31.52, 28.99, 31.24)
    dt.Rows.Add(12, New DateTime(2010, 1, 4), 32.5, 32.75, 28.71, 29.55)
    dt.Rows.Add(13, New DateTime(2009, 12, 1), 30.44, 32.75, 30.3, 32.25)
    dt.Rows.Add(14, New DateTime(2009, 11, 2), 27.38, 30.93, 27.01, 30.22)
    dt.Rows.Add(15, New DateTime(2009, 10, 1), 27.76, 29.98, 26.84, 27.37)
    dt.Rows.Add(16, New DateTime(2009, 9, 1), 25.89, 28.68, 25.25, 27.46)
    dt.Rows.Add(17, New DateTime(2009, 8, 3), 25.52, 27.3, 24.89, 26.04)
    dt.Rows.Add(18, New DateTime(2009, 7, 1), 23.5, 26.84, 22.05, 25.12)
    dt.Rows.Add(19, New DateTime(2009, 6, 1), 24.83, 25.64, 22.55, 23.33)
    dt.Rows.Add(20, New DateTime(2009, 5, 1), 21.76, 26.29, 21.12, 24.22)
    dt.Rows.Add(21, New DateTime(2009, 4, 1), 17.92, 22.57, 17.84, 21.9)
    dt.Rows.Add(22, New DateTime(2009, 3, 2), 16.48, 19.14, 15.14, 18.16)
    dt.Rows.Add(23, New DateTime(2009, 2, 2), 20.08, 20.79, 16.42, 16.77)
    dt.Rows.Add(24, New DateTime(2009, 1, 2), 22.76, 24.83, 19.95, 20.68)
    dt.Rows.Add(25, New DateTime(2008, 12, 1), 22.04, 26.1, 20.27, 22.69)
    dt.Rows.Add(26, New DateTime(2008, 11, 3), 25.85, 26.24, 18.6, 22.52)
    dt.Rows.Add(27, New DateTime(2008, 10, 1), 30.3, 31.06, 21.25, 25.91)
    dt.Rows.Add(28, New DateTime(2008, 9, 2), 32.74, 34.85, 29.25, 30.69)
    dt.Rows.Add(29, New DateTime(2008, 8, 1), 30.5, 33.42, 29.83, 32.35)
    dt.Rows.Add(30, New DateTime(2008, 7, 1), 30.91, 31.77, 28.55, 30.35)
    dt.Rows.Add(31, New DateTime(2008, 6, 2), 33.5, 34.71, 31.14, 31.2)
    dt.Rows.Add(32, New DateTime(2008, 5, 1), 32.45, 35.02, 32.42, 33.6)
    dt.Rows.Add(33, New DateTime(2008, 4, 1), 31.52, 33.03, 29.57, 32.43)
    dt.Rows.Add(34, New DateTime(2008, 3, 3), 32.61, 32.71, 30.05, 31.38)
    dt.Rows.Add(35, New DateTime(2008, 2, 1), 30.75, 33.23, 30.05, 32.41)
    dt.Rows.Add(36, New DateTime(2008, 1, 2), 32.32, 32.63, 26.3, 29.84)
    dt.Rows.Add(37, New DateTime(2007, 12, 3), 33.06, 33.5, 31.71, 32.28)
    dt.Rows.Add(38, New DateTime(2007, 11, 1), 34.51, 34.71, 30.68, 33.15)
    dt.Rows.Add(39, New DateTime(2007, 10, 1), 34.38, 35.69, 33.57, 34.63)
    dt.Rows.Add(40, New DateTime(2007, 9, 4), 33.51, 34.95, 33, 34.39)
    dt.Rows.Add(41, New DateTime(2007, 8, 1), 32.88, 34.93, 31.25, 33.6)
    dt.Rows.Add(42, New DateTime(2007, 7, 2), 34.38, 35.38, 32.99, 33)
    dt.Rows.Add(43, New DateTime(2007, 6, 1), 35.41, 35.89, 33, 34.14)
    dt.Rows.Add(44, New DateTime(2007, 5, 1), 35.09, 36.79, 35.09, 35.44)
    dt.Rows.Add(45, New DateTime(2007, 4, 2), 34.4, 35.47, 34.24, 34.98)
    dt.Rows.Add(46, New DateTime(2007, 3, 1), 33.73, 35.42, 33.28, 34.43)
    dt.Rows.Add(47, New DateTime(2007, 2, 1), 35.09, 36.09, 32.65, 34.25)
    dt.Rows.Add(48, New DateTime(2007, 1, 3), 34.21, 35.97, 33.95, 35.17)
    dt.Rows.Add(49, New DateTime(2006, 12, 1), 33.05, 34.89, 32.76, 34.27)
    dt.Rows.Add(50, New DateTime(2006, 11, 1), 31.55, 33.85, 31.39, 33.05)
    dt.Rows.Add(51, New DateTime(2006, 10, 2), 30.79, 31.99, 30.4, 31.46)
    dt.Rows.Add(52, New DateTime(2006, 9, 1), 29.82, 31.46, 29.3, 30.91)
    dt.Rows.Add(53, New DateTime(2006, 8, 1), 29.65, 30.12, 28.69, 29.65)
    dt.Rows.Add(54, New DateTime(2006, 7, 3), 30.19, 30.45, 28.15, 29.69)
    dt.Rows.Add(55, New DateTime(2006, 6, 1), 30.5, 31.03, 27.95, 30)
    dt.Rows.Add(56, New DateTime(2006, 5, 1), 28.01, 30.53, 27.63, 30.5)
    dt.Rows.Add(57, New DateTime(2006, 4, 3), 27.87, 28.25, 26.75, 27.96)
    dt.Rows.Add(58, New DateTime(2006, 3, 1), 28, 28.85, 27.06, 27.89)
    dt.Rows.Add(59, New DateTime(2006, 2, 1), 25.15, 28.49, 24.9, 27.99)
    dt.Rows.Add(60, New DateTime(2006, 1, 3), 24.08, 26.5, 23.77, 25.31)
    dt.Rows.Add(61, New DateTime(2005, 12, 1), 25.05, 25.7, 23.95, 23.97)
    dt.Rows.Add(62, New DateTime(2005, 11, 1), 24.28, 26.19, 24.28, 24.93)
    dt.Rows.Add(63, New DateTime(2005, 10, 3), 24.13, 25, 22.89, 24.37)
    dt.Rows.Add(64, New DateTime(2005, 9, 1), 25.09, 25.34, 22.9, 24.13)
    dt.Rows.Add(65, New DateTime(2005, 8, 1), 25.64, 26.47, 24.92, 25.19)
    dt.Rows.Add(66, New DateTime(2005, 7, 1), 25.22, 26.5, 24.35, 25.64)
    dt.Rows.Add(67, New DateTime(2005, 6, 1), 27.51, 27.99, 25.12, 25.18)
    dt.Rows.Add(68, New DateTime(2005, 5, 2), 26.57, 28.02, 26.02, 27.44)
    dt.Rows.Add(69, New DateTime(2005, 4, 1), 28.79, 29, 25.71, 26.4)
    dt.Rows.Add(70, New DateTime(2005, 3, 1), 27.97, 29, 27.47, 28.73)
    dt.Rows.Add(71, New DateTime(2005, 2, 1), 28.75, 29.99, 27.51, 27.94)
    dt.Rows.Add(72, New DateTime(2005, 1, 3), 27.81, 28.94, 27.05, 28.63)
    dt.Rows.Add(73, New DateTime(2004, 12, 1), 26.97, 28.03, 26.68, 27.8)

    Return dt
End Function