Spline Chart
A Spline chart, as part of the ASP NET AJAX Chart, is a form of line/area chart where each data point from the series is connected with a fitted curve that represents a rough approximation of the missing data points. You could plot the following series with a spline interpolation: AreaSeries, LineSeries, ScatterLineSeries, RadarLineSeries, RadarAreaSeries, PolarLineSeries and PolarAreaSeries. Telerik added the spline chart in Q1 2014.
You can display a fitted curve through the data points from the series by setting the LineAppearance.LineStyle property of the series to "Smooth". For example:
<telerik:AreaSeries Name="Area Series">
    <LineAppearance LineStyle="Smooth" />
</telerik:AreaSeries>
The code in Example 1 will show you how to build spline series in Figure 1.
Figure 1: Data points in area and line series are connected through interpolated curves. The code in Example 1 illustrates how to setup spline area and line series.
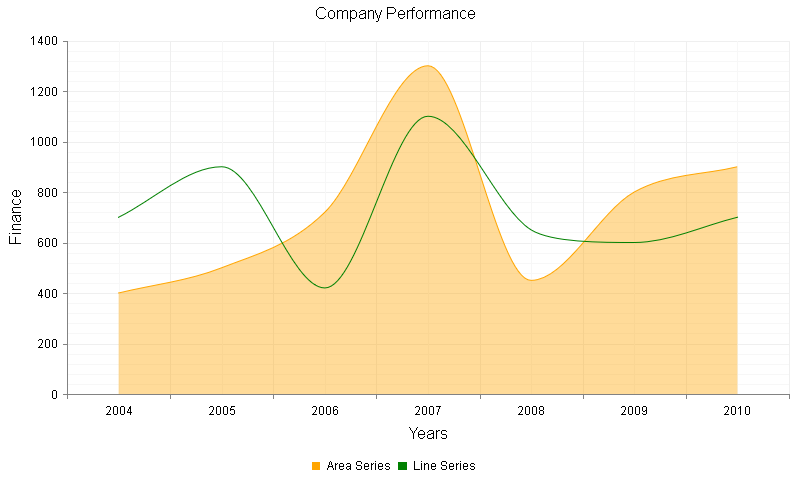
Example 1: Creating a chart that has two spline series - AreaSeries and LineSeries. Spline functionality is enabled by simply setting the LineAppearance.LineStyle property of the series to "Smooth"
<telerik:RadHtmlChart runat="server" ID="AreaLineSplineChart" Width="800" Height="500" Transitions="true">
    <PlotArea>
        <Series>
            <telerik:AreaSeries Name="Area Series">
                <LineAppearance LineStyle="Smooth" />
                <Appearance>
                    <FillStyle BackgroundColor="Orange" />
                </Appearance>
                <LabelsAppearance Visible="false" />
                <MarkersAppearance Visible="false" />
                <SeriesItems>
                    <telerik:CategorySeriesItem Y="400" />
                    <telerik:CategorySeriesItem Y="500" />
                    <telerik:CategorySeriesItem Y="720" />
                    <telerik:CategorySeriesItem Y="1300" />
                    <telerik:CategorySeriesItem Y="450" />
                    <telerik:CategorySeriesItem Y="800" />
                    <telerik:CategorySeriesItem Y="900" />
                </SeriesItems>
            </telerik:AreaSeries>
            <telerik:LineSeries Name="Line Series">
                <LineAppearance LineStyle="Smooth" />
                <Appearance>
                    <FillStyle BackgroundColor="Green" />
                </Appearance>
                <LabelsAppearance Visible="false" />
                <MarkersAppearance Visible="false" />
                <SeriesItems>
                    <telerik:CategorySeriesItem Y="700" />
                    <telerik:CategorySeriesItem Y="900" />
                    <telerik:CategorySeriesItem Y="420" />
                    <telerik:CategorySeriesItem Y="1100" />
                    <telerik:CategorySeriesItem Y="650" />
                    <telerik:CategorySeriesItem Y="600" />
                    <telerik:CategorySeriesItem Y="700" />
                </SeriesItems>
            </telerik:LineSeries>
        </Series>
        <CommonTooltipsAppearance Color="White"></CommonTooltipsAppearance>
        <XAxis>
            <MajorGridLines Color="#EFEFEF" Width="1" />
            <MinorGridLines Color="#F7F7F7" Width="1" />
            <Items>
                <telerik:AxisItem LabelText="2004" />
                <telerik:AxisItem LabelText="2005" />
                <telerik:AxisItem LabelText="2006" />
                <telerik:AxisItem LabelText="2007" />
                <telerik:AxisItem LabelText="2008" />
                <telerik:AxisItem LabelText="2009" />
                <telerik:AxisItem LabelText="2010" />
            </Items>
            <TitleAppearance Position="Center" Text="Years" />
        </XAxis>
        <YAxis>
            <MajorGridLines Color="#EFEFEF" Width="1" />
            <MinorGridLines Color="#F7F7F7" Width="1" />
            <TitleAppearance Position="Center" Text="Finance" />
        </YAxis>
    </PlotArea>
    <ChartTitle Text="Company Performance">
        <Appearance Align="Center" Position="Top" />
    </ChartTitle>
    <Legend>
        <Appearance Position="Bottom" />
    </Legend>
</telerik:RadHtmlChart>