Color Ranges
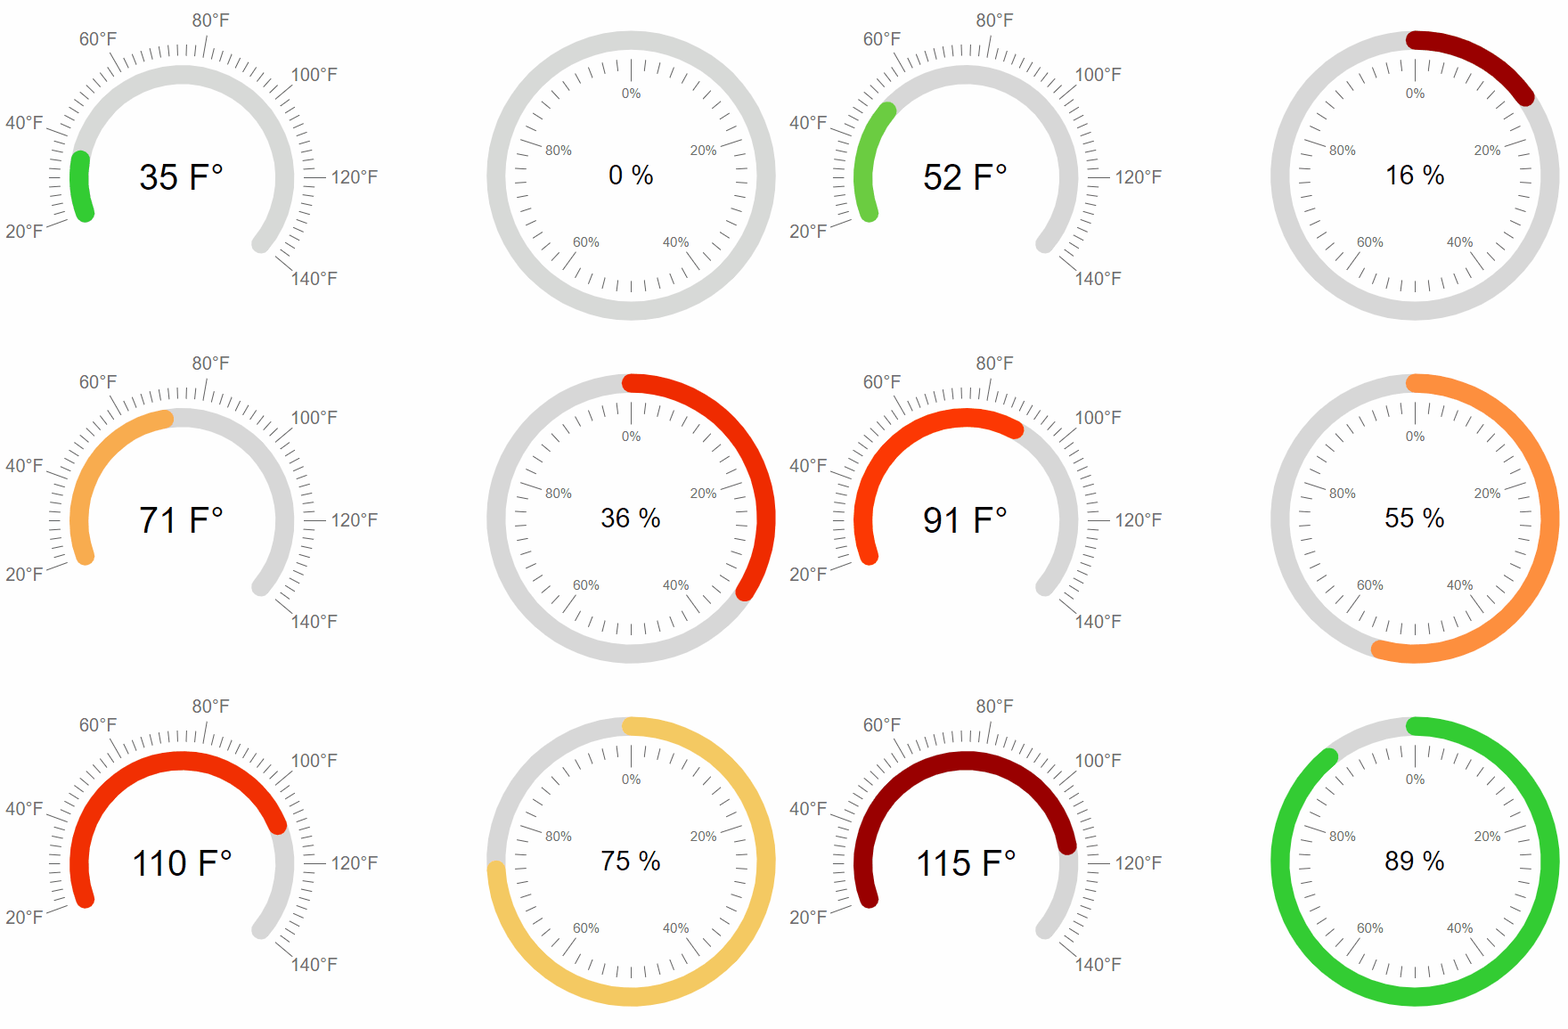
The RadArcGauge and RadCircularGauge Controls enables you to set different colors depending on the current value of the Gauge.
To configure the range colors, define ArcGaugeColor elements within the ColorsCollection inner tag. Each Color element has covers a range From - To, and has its own color specified.

<telerik:RadArcGauge runat="server" ID="RadArcGauge1" Height="350" Width="350" Font-Size="XX-Large" Skin="Silk" Value="35">
<CenterTemplate>
#:value # F°
</CenterTemplate>
<Scale Min="20" Max="140" StartAngle="-20" EndAngle="220">
<Labels Visible="true" Position="Outside" Font="16px Arial,Helvetica,sans-serif" Format="{0}°F" />
<MajorTicks Visible="true" Size="20" Color="Black" />
<MinorTicks Visible="true" Color="Black" />
</Scale>
<ColorsCollection>
<telerik:ArcGaugeColor From="20" To="49" Color="#33cc33" />
<telerik:ArcGaugeColor From="50" To="69" Color="#ffcc66" />
<telerik:ArcGaugeColor From="70" To="109" Color="#ff3300" />
<telerik:ArcGaugeColor From="110" To="140" Color="#990000" />
</ColorsCollection>
</telerik:RadArcGauge>
<telerik:RadCircularGauge runat="server" ID="RadCircularGauge1" Height="350" Width="350" Font-Size="X-Large" Skin="Silk" Value="0">
<CenterTemplate>
#:value # %
</CenterTemplate>
<Scale Min="0" Max="100">
<Labels Visible="true" Position="Inside" Font="12px Arial,Helvetica,sans-serif" Format="{0}%" />
<MajorTicks Visible="true" Size="20" Color="Black" />
<MinorTicks Visible="true" Color="Black" />
</Scale>
<ColorsCollection>
<telerik:ArcGaugeColor From="0" To="24" Color="#990000" />
<telerik:ArcGaugeColor From="25" To="49" Color="#ff3300" />
<telerik:ArcGaugeColor From="50" To="74" Color="#ffcc66" />
<telerik:ArcGaugeColor From="75" To="100" Color="#33cc33" />
</ColorsCollection>
</telerik:RadCircularGauge>
The animation in the image above is achieved with dynamically increasing the value of the Gauge with the following custom JavaScript logic
function pageLoad() {
    var arcGauge = $find("<%=RadArcGauge1.ClientID %>");
    var circularGauge = $find("<%=RadCircularGauge1.ClientID %>");
    heatUp(arcGauge, 115);
    heatUp(circularGauge, 89);
}

function heatUp(gauge, targetValue) {
    var currentValue = gauge.get_value();
    if (gauge.get_value() < targetValue) {
        setTimeout(function () {
            gauge.set_value(currentValue + 1);
            heatUp(gauge, targetValue);
        }, 30)
    }
}
Check out our live demo of this functionality: Color Ranges.