Gantt Charts
RadChart has been replaced by RadHtmlChart, Telerik's client-side charting component. If you are considering RadChart for new development, examine the RadHtmlChart documentation and online demos first to see if it will fit your development needs. If you are already using RadChart in your projects, you can migrate to RadHtmlChart by following these articles: Migrating Series, Migrating Axes, Migrating Date Axes, Migrating Databinding, Features parity. Support for RadChart is discontinued as of Q3 2014, but the control will remain in the assembly so it can still be used. We encourage you to use RadHtmlChart for new development.
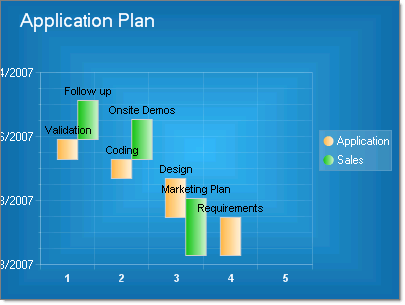
Gantt charts help visualize time based information. Gantt charts, also known as Time charts, display separate events, with a beginning and an end. These charts are often used for project/time planning, where data can be plotted using a date-time scale or a numerical scale.
To create a vertical Gantt Chart set the SeriesOrientation property to Vertical. Set the RadChart DefaultType property or ChartSeries.Type to Gantt.
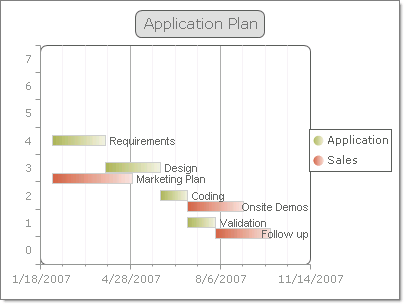
To create a horizontal Gantt Chart set the SeriesOrientation property to Horizontal. Set the RadChart DefaultType property or ChartSeries.Type to Gantt.
Other Gantt chart issues:
To add dates to an axis or chart item, values must be converted to OleAutomation types.Use the DateTime.ToOADate() function for this purpose.
When setting a range for an axis that involves dates, set the axis IsZeroBased property to zero.This avoids having the range calculated from the minimum date value forward, instead of a range you define.
Use the ValueFormat property to display values as dates.
RadChart1.PlotArea.YAxis.Appearance.ValueFormat = Telerik.Charting.Styles.ChartValueFormat.ShortDate;
RadChart1.PlotArea.YAxis.Appearance.ValueFormat = Telerik.Charting.Styles.ChartValueFormat.ShortDate