Area Charts
RadChart has been replaced by RadHtmlChart, Telerik's client-side charting component. If you are considering RadChart for new development, examine the RadHtmlChart documentation and online demos first to see if it will fit your development needs. If you are already using RadChart in your projects, you can migrate to RadHtmlChart by following these articles: Migrating Series, Migrating Axes, Migrating Date Axes, Migrating Databinding, Features parity. Support for RadChart is discontinued as of Q3 2014, but the control will remain in the assembly so it can still be used. We encourage you to use RadHtmlChart for new development.
The Area chart consists of a series of data points joined by a line and where the area below the line is filled. Area charts are appropriate for visualizing data that fluctuates over a period of time and can be useful for emphasizing trends.Note: Values that don't vary too wildly work best for area charts.
Area charts display series in the order they are added, back-to-front.Depending on the Skin used, RadChart can automatically differentiate each series by displaying it in a different color. The appearance for each series can also be modified directly.
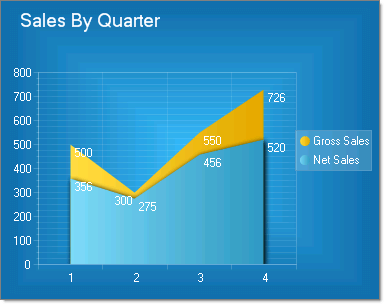
To create a Vertical Area Chart set the SeriesOrientation property to Vertical. Set the RadChart DefaultType property or ChartSeries.Type to Area.
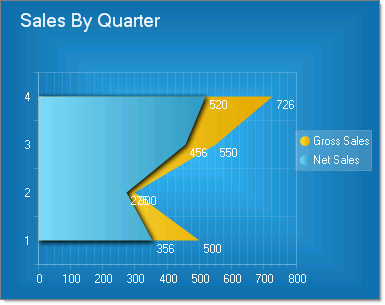
To create a Horizontal Area Chart set the SeriesOrientation property to Horizontal. Set the RadChart DefaultType property or ChartSeries.Type to Area.