How to: Detect Too Many Records Fetched Problems
Too Many Records Fetched problem indicates that a query fetched more records than usual. Such queries might take long time to execute, decreasing the performance of your application. If this is not the required behavior, consider using the Skip and Take LINQ operators to retrieve the needed information only.
How to Detect Too Many Records Fetched Problem
Detecting Too Many Records Fetched problems with the Telerik Data Access Profiler is easy. Just navigate to the Alerts View and look for Too Many Records Fetched alerts.
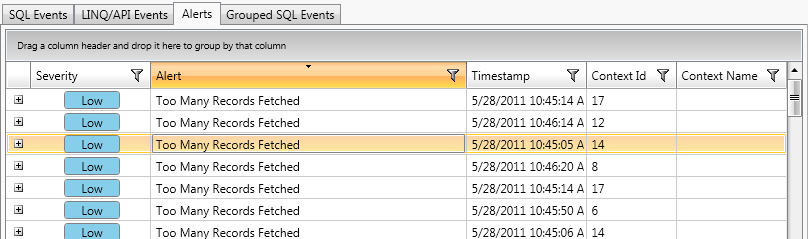
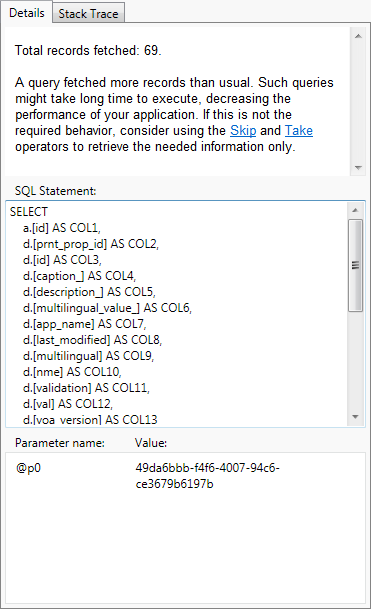
If you select a row in the grid control, then details about the alert will appear at the right side of the screen, i.e. description of the problem, total records fetched and the complete SQL statement.
Locating the Issue in the Source Code
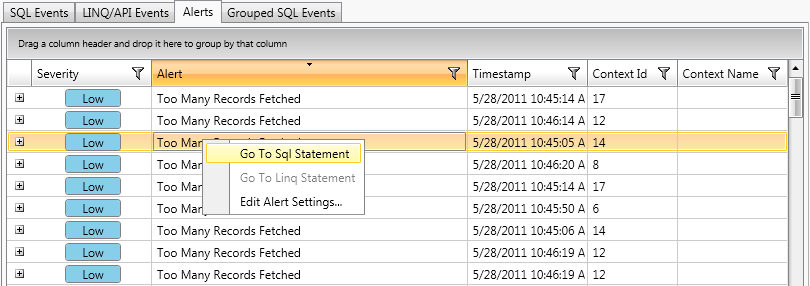
The Telerik Data Access profiler can give you the exact line in the source code that causes the Too Many Records Fetched problem. While you are still in the Alerts View, right-click the row representing the Too Many Records Fetched issue and select Go to Sql Statement.
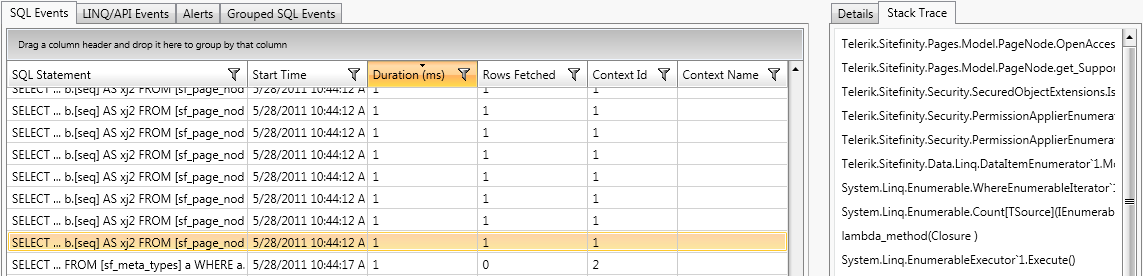
This will lead you to the SQL Events view. There, you can get information about the stack trace and see exactly which method in your code is causing the Too Many Records Fetch issue. You need to take a look at the StackTrace tab page at the right part of the screen. The Details tab page gives you information about the SQL statement that is executed.
By default StackTrace information is not included in the log files. In order to log stack trace information, you need to set the StackTrace property to True. For more information, you could take a look at the Logging Configuration topic.
How to Configure the Conditions for the Different Alert Levels
You could edit the alert settings for the "too many records fetched" problem in the Profiler Settings dialog. Open the Profiler Settings dialog and go to the Alert Rules.