How to: Detect Runtime Exceptions
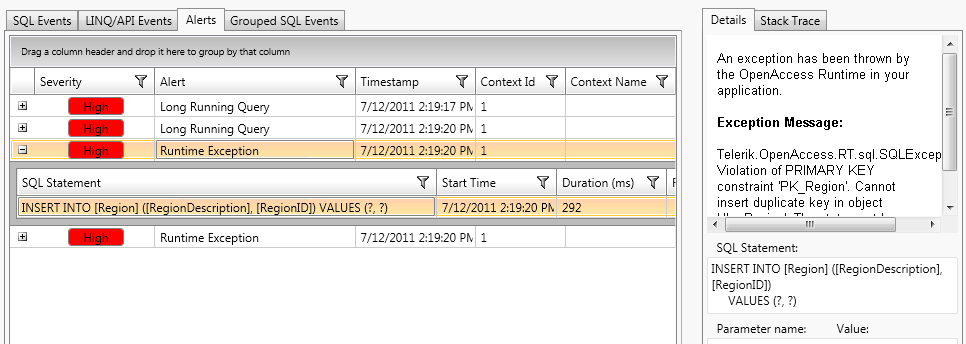
The Telerik Data Access Profiler and Tuning Advisor can detect exceptions that have been thrown by the Telerik Data Access Runtime in your application. All runtime exceptions are transformed into alerts with severity level High.

Locating the Issue in the Source Code
The Telerik Data Access profiler can give you the exact line in the source code that causes the runtime exception. While you are still in the Alerts View, right-click the row representing the runtime exception and select Go to Sql Statement. This will lead you to the SQL Events view. There, you can get information about the stack trace and see exactly which method in your code is causing the runtime exception. You need to take a look at the StackTrace tab page at the right part of the screen. The Details tab page gives you information about the SQL statement that is executed.
By default StackTrace information is not included in the log files. In order to log stack trace information, you need to set the StackTrace property to True. For more information, you could take a look at the Logging Configuration topic.
How to Enable/Disable the Runtime Exceptions Alert
You could edit the alert settings for the "runtime exceptions" problem in the Profiler Settings dialog. Open the Profiler Settings dialog and go to the Alert Rules.
