How to: Detect and Solve N+1 Problems
Select N+1 is a data access anti-pattern where the database is accessed in a suboptimal way. Detecting Select N+1 problem usually means that the data fetch strategy of the application can be optimized. By default traversing a collection of related objects would lead to the execution of an additional query for each object in the collection. While this would still work, it is highly inefficient.
Consider the database diagram below, where three tables from the Northwind database (Customers, Orders and OrderDetails) are represented.

Suppose you have a Telerik Data Access Model and you want to show the user all orders and order details for all customers. To fill the entity objects with data from the database, several steps are required. In the first step, you need an OpenAccessContext instance. Then you need a LINQ query to load Customer objects from the database. Finally, start iterating through the Customer, Order and OrderDetail objects.
- C#
- VB
NorthwindDbContext dbContext = new NorthwindDbContext();
IQueryable<Customer> query = from c in dbContext.Customers
                               where c.Country == "Germany"
                               select c;

foreach (Customer customer in query)
{
   Console.WriteLine("Customer Id: {0}", customer.CustomerID);
   foreach (Order order in customer.Orders)
   {
       Console.WriteLine("===Order date: {0}", order.OrderDate.ToString("d"));
       foreach (OrderDetail orderDetail in order.OrderDetails)
       {
           Console.WriteLine("======Unit price: {0}", orderDetail.UnitPrice.ToString("c"));
       }
   }
}
Dim dbContext As New NorthwindDbContext()
Dim query As IQueryable(Of Customer) = From c In dbContext.Customers
                                       Where c.Country = "Germany"
                                       Select c
For Each c As Customer In query
 Console.WriteLine("Customer Id: {0}", c.CustomerID)
 For Each o As Order In c.Orders
  Console.WriteLine("===Order date: {0}", o.OrderDate.ToString("d"))
  For Each od As OrderDetail In o.OrderDetails
   Console.WriteLine("======Unit price: {0}", od.UnitPrice.ToString("c"))
  Next od
 Next o
Next c
If you analyze the previous code-snippet, you can see that you are loading a list of customers (the first select). Then, you are traversing the object graph. What you have here is a lazy loading. You are forcing Telerik Data Access to go to the database and bring the results back one row at a time. While this approach will work, it is highly inefficient.
How to Solve the Select N+1 Problem
The solution is extremely simple. You need to force an eager load of the collection using the Telerik Data Access FetchPlans API to specify what pieces of the object model you want to include in the initial query. For more information take a look at the Getting Started with FetchPlans API topic.
Note, that this is the classical appearance of the problem. It can also surface in other cases, such as calling the database in a loop, or traversing a more complex graph. In those cases, it is difficult to see what the reason is. Fortunately, the Telerik Data Access Profiler will detect those scenarios as well, and give you the exact line in the source code that causes this issue.
How to Detect the Select N+1 Problem
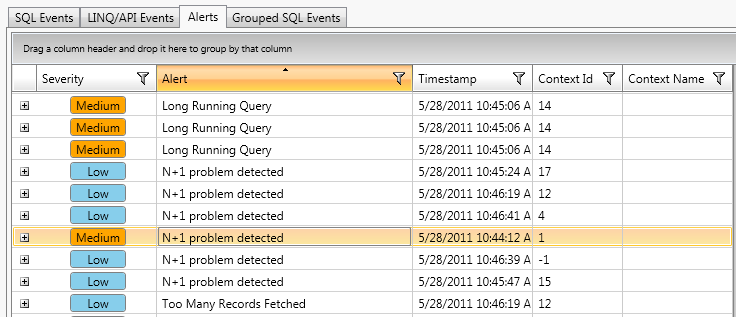
Detecting the Select N+1 problem with the Telerik Data Access Profiler is easy. Just navigate to the Alerts View and look for N+1 problem alerts.

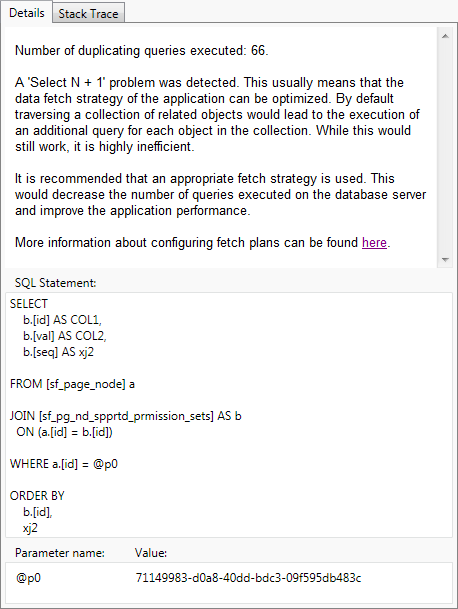
If you select the row in the grid control, then details about the alert will appear at the right side of the screen, i.e. description of the problem and the complete SQL statement.

Locating the Issue in the Source Code
The Telerik Data Access profiler can give you the exact line in the source code that causes the N+1 problem. While you are still in the Alerts View, right-click the row representing the N+1 issue and select Go to Sql Statement.

This will lead you to the SQL Events view. There, you can get information about the stack trace and see exactly which method in your code is causing the N+1 issue. You need to take a look at the StackTrace tab page at the right part of the screen. The Details tab page gives you information about the SQL statement that is executed.

By default StackTrace information is not included in the log files. In order to log stack trace information, you need to set the StackTrace property to True. For more information, you could take a look at the Logging Configuration topic.
How to Configure the Conditions for the Different Alert Levels
You could edit the alert settings for the N+1 problem in the Profiler Settings dialog. Open the Profiler Settings dialog and go to the Alert Rules.
