How to: Detect Long Running Queries
The Telerik Data Access Profiler and Tuning Advisor detects long running queries.
If a long running query is expected, make sure the query does not exceed the connection timeout, which is 120 seconds by default. You can configure the connection timeout by the ConnectionPool settings. You need to change the ActiveConnectionTimeout setting.
How to Detect Long Running Queries
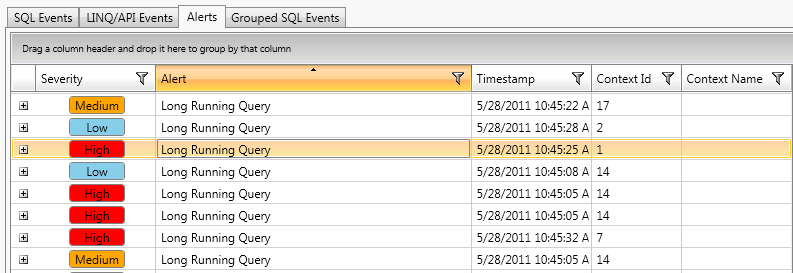
Detecting Long Running Query problems with the Telerik Data Access Profiler is easy. Just navigate to the Alerts View and look for Long Running Query alerts.

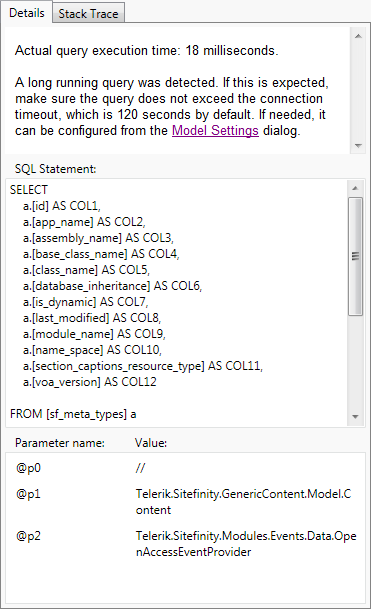
If you select a row in the grid control, then details about the alert will appear at the right side of the screen, i.e. description of the problem, execution time and the complete SQL statement.

In this example, the execution time for the selected query is 18 milliseconds.
Locating the Issue in the Source Code
The Telerik Data Access profiler can give you the exact line in the source code that causes the Long Running Query problem. While you are still in the Alerts View, right-click the row representing the Long Running Query issue and select Go to Sql Statement.

This will lead you to the SQL Events view. There, you can get information about the stack trace and see exactly which method in your code is causing the Long Running Query issue. You need to take a look at the StackTrace tab page at the right part of the screen. The Details tab page gives you information about the SQL statement that is executed.

By default StackTrace information is not included in the log files. In order to log stack trace information, you need to set the StackTrace property to True. For more information, you could take a look at the Logging Configuration topic.
How to Configure the Conditions for the Different Alert Levels
You could edit the alert settings for the "long running queries" problem in the Profiler Settings dialog. Open the Profiler Settings dialog and go to the Alert Rules.
How to Avoid Long Running Queries
Avoid Queries with Too Many Joins
Queries with too many joins might be a performance issue. Each join requires the server to perform additional work, and the cost of the query grows rapidly with each additional join. While today's relational databases are optimized for handling joins, it is often more efficient to perform several separate queries instead of a single query with several joins in it.
Another issue you have to pay attention to is possible Cartesian products when you perform a multiple-table query. A Cartesian product consists of every possible combination of rows from the tables. This result is usually large and unwieldy.
Avoid Queries (Like '%....')
Queries (Like '%....') will force the database to scan the full table. E.g:
- SQL
select * from Products where ProductName like '%test'
