Profiling Data
This article is relevant to entity models that utilize the deprecated Visual Studio integration of Telerik Data Access. The current documentation of the Data Access framework is available here.
Telerik Data Access Profiler and Tuning Advisor is a graphical user interface for monitoring of all the Telerik Data Access activity in your application. It makes it easy for developers to see how Telerik Data Access is working behind the scenes. You can see all SQL queries sent to the database server, and the LINQ statement that generated them. In addition, the profiler has a built in alert system that will notify about potential issues, and suggest resolutions.
Configuring Telerik Data Access Project For Real-Time Monitoring
Telerik Data Access Profiler offers you a real-time (live) monitoring via a Telerik Data Access implemented web service. This section demonstrates you how to configure a Telerik Data Access application for a real-time monitoring.
Preparing an Application to be Profiled
-
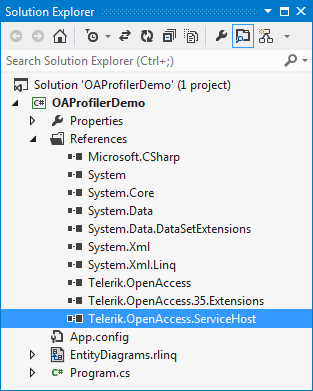
First, you need to add a reference to the Telerik.OpenAccess.ServiceHost.dll assembly.
The second step is to configure your domain model. Open your domain model in Visual Designer. You need to set few options in Model Settings Dialog. Right-click on an empty area in Visual Designer and select Show Model Settings.
- This will open Model Settings Dialog. Go to the Backend Configuration -> Tracing and Logging settings. The Tracing and Logging settings allow you to configure the event logging properties, such as specifying the log file name, controlling the amount of logging information to be generated, etc.
-
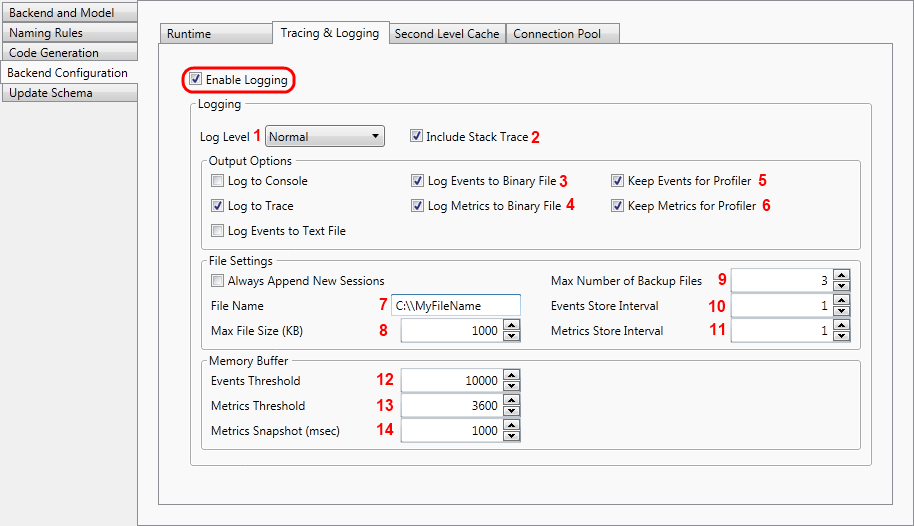
The snapshot below shows you the minimal settings you need to consider and/or specify:
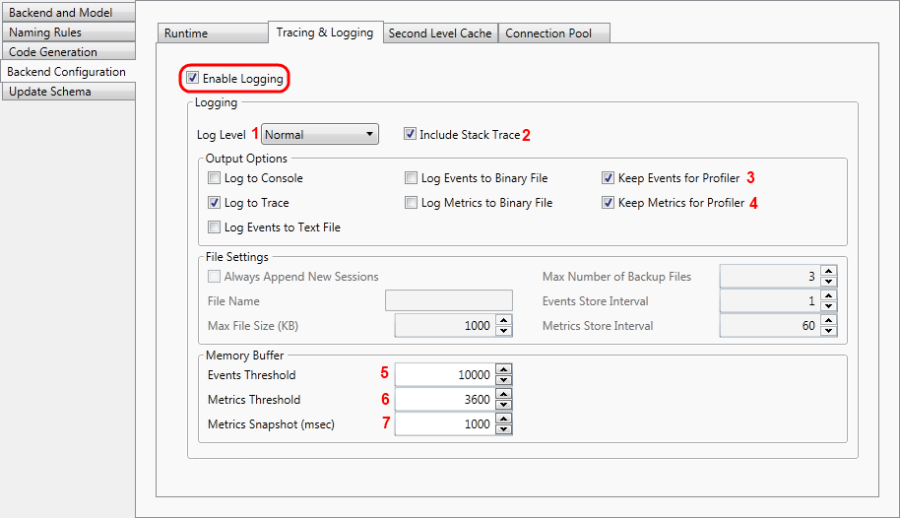
Ensure that the Enable Logging option is set to True.
- The next step is to specify the amount of logging information to be generated. By default, only application Errors (exceptions) are logged. So, at this point if you connect the Telerik Data Access Profiler to the Telerik Data Access web service for online monitoring, you won't see any events and metrics. This is controlled by the Log Level setting. The event logging levels are as follows:
- None - logs no events.
- Errors - logs only serious errors (such as connections timing out). This is the default value.
- Normal - logs the most useful events that do not reduce performance significantly (e.g. SQL executed).
- Verbose - logs lots of events (this slows down the performance, could be used while debugging).
- All - logs all possible events (this slows down the performance very significantly, could be used while debugging).
- The Include Stack Trace setting controls if the logging facilities append stack trace information. The default value for this option is False. In this demo it is set to True.
- Telerik Data Access produces two different kinds of data - metrics and events. Metrics are similar to the operating system counters. They produce snapshots of the system status like counting insert, update and delete statements per second. Log events contain the real operation information, including query parameters and stack traces. Compared to metrics, the production of log events is far more expensive and can slow down the application. Set the following options to True:
- Keep Events for Profiler - allows the user to configure the events store.
- Keep Metrics for Profiler - allows the user to configure the metrics store.
- The final step is to define the size of the event/metric store in the memory. This is controlled by the Events Threshold and Metrics Threshold settings.
- Click OK to close the dialog.
-
Next, you need to start the web service host from the application. In the application start-up, paste the code shown below. This will start the service communication on the port 15555. You can use different port, by passing a different port number to StartService method. In Web applications, the service could be started in the Application_Start event handlers in the Global.asax.cs class. In Windows applications, you could start the service before showing the first form.
Telerik.OpenAccess.ServiceHost.ServiceHostManager.StartProfilerService(15555);Telerik.OpenAccess.ServiceHost.ServiceHostManager.StartProfilerService(15555) -
You could optionally shut down the service, it is not mandatory. You need to call the StopProfilerService method. In Web applications, the service could be stopped in the Application_End event handlers in the Global.asax.cs class. In Windows applications, you could stop the service in the closing event of the main form.
Telerik.OpenAccess.ServiceHost.ServiceHostManager.StopProfilerService();Telerik.OpenAccess.ServiceHost.ServiceHostManager.StopProfilerService() Run the application.
Starting the Profiler
-
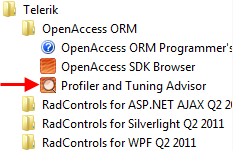
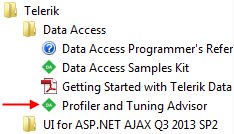
Open Telerik Data Access Profiler and Tuning Advisor. You could do this from the Windows start menu.
-
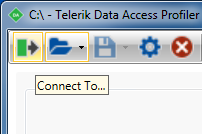
In order to start a real-time monitoring in the Telerik Data Access Profiler, you need to use the Connect To toolbar command.
This will open the Open Connection dialog. Here you need to enter the connection string name (from the app/web config file) and the server name you are using in your application, as well as the port number you have passed to the web service.
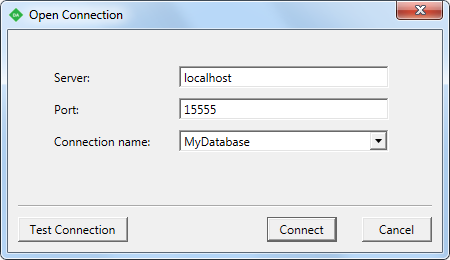
- Once configured click Test Connection at which point the profiler will indicate whether or not it was able to successfully connect to the service host. If Test Connection reports a failure, ensure that the application is running, and that you specified correct info on the Open Connection dialog. Once Test Connection comes back successful, click Connect.
- At this point you are ready to use your application, and all activity will be reported to the profiler.
Configuring Telerik Data Access Project For Offline Monitoring
Telerik Data Access allows you to generate files with snapshots of all the Telerik Data Access activities in your application, which you can use for later analysis by loading the files into the Telerik Data Access Profiler. This is known as offline profiling. This section will show you how to configure your Telerik Data Access project for offline monitoring.
Preparing an Application to be Profiled
- The first step is to configure your domain model. Open your domain model in the Visual Designer. You need to set few options in the Model Settings Dialog. Right-click on an empty area in the Visual Designer and select Show Model Settings.
- This will open the Model Settings Dialog. Go to the Backend Configuration -> Tracing and Logging settings. The Tracing and Logging settings allow you to configure the event logging properties, such as specifying the log file name, controlling the amount of logging information to be generated, etc.
-
The snapshot below shows you the minimal settings you need to consider and/or specify:
Run the application, and click through various scenarios. All Telerik Data Access activity will be logged to specified file. When finished, close the application.
Starting the Profiler
-
Open Telerik Data Access Profiler and Tuning Advisor. You could do this from the Windows start menu.
-
In order to load log files in the Telerik Data Access Profiler, you need to use the Open Folder toolbar command.
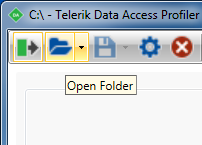
Navigate to the directory the log was saved, for example, in this guide it was saved to the root C drive.
-
Select the .oalog file. The Telerik Data Access logger produces two files:
- .oalog file - contains all of the operation information.
- .oametrics file - contains all of the counters for the OpenAccessContext. Things like context lifetime, inserts per second, selects per second, cache hits, cache misses, etc. are stored in this file.
The log should now be ready for you to explore in the Telerik Data Access Profiler and Tuning Advisor.
Next Steps
For more information about the Telerik Data Access Profiler, please refer to the Telerik Data Access Profiler and Tuning Advisor section.