How to: Configure Telerik® Data Access Project For Offline Monitoring
This article is relevant to entity models that utilize the deprecated Visual Studio integration of Telerik Data Access. The current documentation of the Data Access framework is available here.
This topic demonstrates how to configure a Telerik Data Access project for offline profiling. Telerik Data Access allows you to generate files with snapshots of all the Telerik Data Access activities in your application, which you can use for later analysis by loading the files into the Telerik Data Access Profiler.
The entire configuration is done via the Model Settings Dialog. To configure your project for offline monitoring:
- Right-click on an empty area in the Visual Designer and select Show Model Settings.
- This will open the Model Settings Dialog. Go to the Backend Configuration -> Tracing and Logging settings. The Tracing and Logging settings allows you to configure the event logging properties, such as specifying the log file name, controlling the amount of logging information to be generated, etc.
-
The snapshot below shows you the minimal settings you need to consider and/or specify:
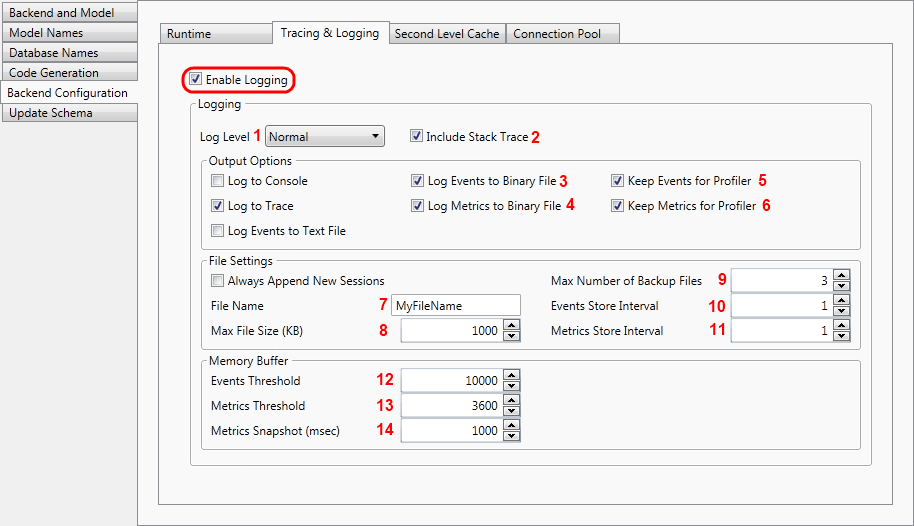
Ensure that the Enable Logging option is set to True.
- The first step is to specify the amount of logging information to be generated. This is controlled by the Log Level setting. The event logging levels are as follows:
- None - logs no events.
- Errors - logs only serious errors (such as connections timing out). This is the default value.
- Normal - logs the most useful events that do not reduce performance significantly (e.g. SQL executed).
- Verbose - logs lots of events (this slows down the performance, could be used while debugging).
- All - logs all possible events (this slows down the performance very significantly, could be used while debugging).
- The Include Stack Trace setting controls if the logging facilities append stack trace information. The default value for this option is False. In this demo it is set to True.
- Telerik Data Access produces two different kinds of data - metrics and events. Metrics are similar to the operating system counters. They produce snapshots of the system status like counting insert, update and delete statements per second. Log events contain the real operation information, including query parameters and stack traces. Compared to metrics, the production of log events is far more expensive and can slow down the application. Set the following options to True:
- Log Events to Binary File - specifies whether events should be logged in binary form or not.
- Log Metrics to Binary File - specifies whether metrics should be logged in binary form or not.
- Keep Events for Profiler - allows the user to configure the events store.
- Keep Metrics for Profiler - allows the user to configure the metrics store.
-
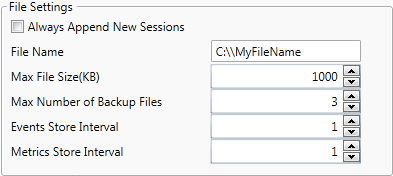
The next step is to specify the File Name. Telerik Data Access writes metrics and log events in different files. With the default settings, Telerik Data Access stores the log files in the application working directory (the \bin\debug directory). The default name for the log events file is openaccess_<ConnectionID>.oalog. The default name for the metrics file is openaccess_<ConnectionID>.oametrics. Where <ConnectionID> is the connection alias name that is used in the application, i.e. the name of the connection string in the app/web.config file. For example, if the name of the connection string is SofiaCarRentalDbConnection, then the names of the log files will be: openaccess_SofiaCarRentalDbConnection.oalog and openaccess_SofiaCarRentalDbConnection.oametrics. And these files will be stored in the application working directory.
The above settings will produce the files MyFileName.oalog and MyFileName.oametrics in the working directory.If you want to use a full qualified path, you need to ensure that the path exists. Telerik Data Access will not create directories.
The maximum file size and the maximum amount of historical files can be configured. To do that, you need to use the MaxFileSizeKB and the Max Number of Backup Files settings. By default the maximum size of the log files is 1000KB and the maximum amount of historical files is 3. If the log file reaches the configured maximum size, it is renamed to fileName.1. If a file with name fileName.1 already exists, then it is renamed to fileName.2. If the maximum number of files has been reached, the oldest file is deleted. The new data will be stored in a new file.
- The log files are written by a background process so that the application gets only minimal disturbance. The events have to be generated and stored in memory so that the background process can write them in the log files. The most important settings are: how much data is stored in memory and how often the store thread is started to write it to the files. In order to define the size of the event/metric store in the memory, you need to use the Metrics Threshold and Events Threshold properties.
- The second important setting is how often the background thread is started to write data to the files. For metrics the store interval is not too critical because usually Telerik Data Access generates one counter snapshot per second. The metric snapshots are stored in an int array. However, the store interval for events is critical. If the process generates more events than the configured buffer can store before the background process wakes up, the events are lost. By default, the store thread writes metrics to the file in interval of 60 seconds. By default, events are written in interval of 1 second. You need to set the Events Store Interval and Metrics Store Interval properties.
Customizing Binary Log Files
Telerik Data Access writes metrics and log events in different files. With the default settings, Telerik Data Access stores the log files in the application working directory (the \bin\debug directory). In the previous section you saw how to specify the File Name setting. You set the File Name to MyFileName and this will produce the files MyFileName.oalog and MyFileName.oametrics in the working directory
If you want to use a full qualified path, you need to ensure that the path exists. Telerik Data Access will not create directories. For example:
This will produce the files MyFileName.oalog and MyFileName.oametrics in C:.
It is also possible to add specific information to the file name. Telerik Data Access just searches and replaces the following string tags:
| Marker | Replaced By |
| {DateTime.Now} | DateTime.Now |
| {DateTime.UtcNow} | DateTime.UtcNow |
| {DateTime.Ticks} | DateTime.Now.Ticks |
| {ConnectionId} | <ConnectionId> |
| {ProcessId} | Process id |
For example, setting the File Name to c:\Proc-{ProcessId}-db-{DateTime.Ticks} will produce the files Proc-6200-db-634449584490025540.oalog and Proc-6200-db-634449584490025540.oametrics in C:\.
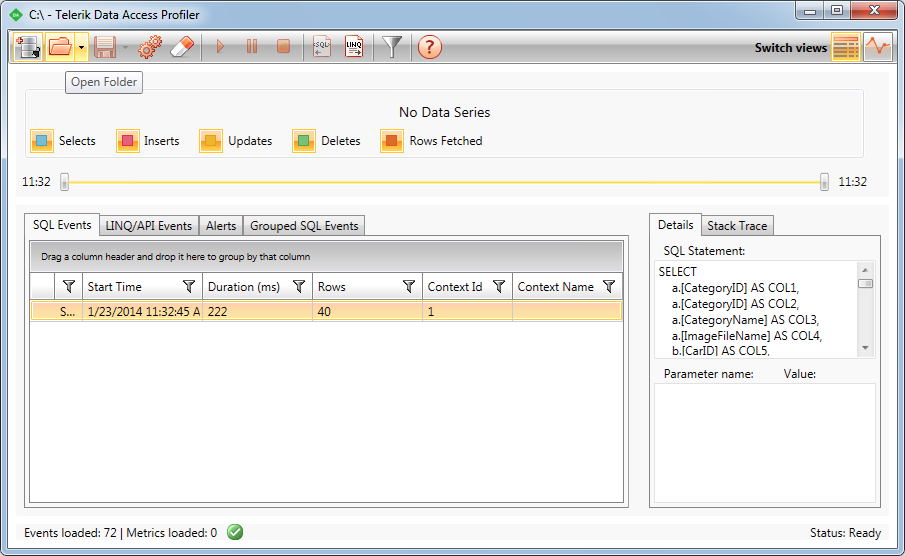
Loading Offline Data in the Telerik Data Access Profiler
In order to load log files in the Telerik Data Access Profiler, you need to use the Open Folder Toolbar Command. It doesn't matter which file will be chosen. Both files are connected. If you choose one of them, the profiler will load the second automatically.