Introducing the Telerik® Data Access Profiler and Tuning Advisor
This article is relevant to entity models that utilize the deprecated Visual Studio integration of Telerik Data Access. The current documentation of the Data Access framework is available here.
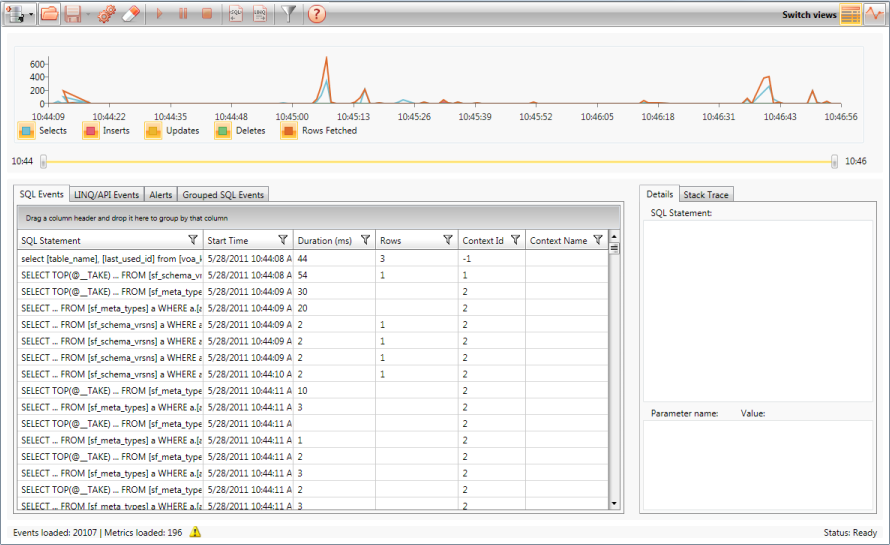
Telerik Data Access Profiler and Tuning Advisor is a graphical user interface for monitoring of all the Telerik Data Access activity in your application. For example, you can monitor a production environment to see which queries are affecting performance by executing too slowly.

Starting the Telerik Data Access Profiler
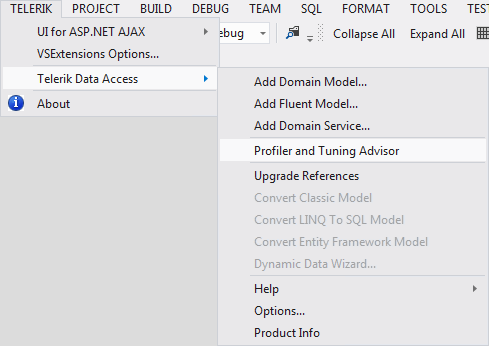
You could start the Telerik Data Access Profiler via the Telerik->Telerik Data Access->Profiler and Tuning Advisor menu command.

Or, you could start the profiler directly from the Telerik Data Access installation directory (~\Telerik\OpenAccess ORM\bin\Telerik.OpenAccess.Profiler.exe).
Two Views For Displaying Information
Telerik Data Access produces two different kinds of data - metrics and events. Metrics are similar to the operating system counters. They produce snapshots of the system status like counting insert, update and delete statements per second. Log events contain the real operation information, including query parameters and stack traces. The Telerik Data Access Profiler provides views for both data types - Events View and Metrics View. The Events View is the default view you are going to see when you start the Telerik Data Access Profiler for first time. You could switch to the Metrics View by using the Metrics View Toolbar Command.
Saving the Trace Data Locally
The Telerik Data Access Profiler allows you to store the trace data locally for analysis - just be clicking the Save button you will have the trace saved in a file you choose.
Two Ways For Monitoring Your Application
The Telerik Data Access Profiler allows you to monitor your application in two different ways:
- Offline monitoring - you can capture and save data about each event to a file to analyze later.
- Real-time (live) monitoring - you can download a real-time data via a Telerik Data Access implemented web service.
Both ways can be used in parallel to generate and store the data. The following topics describe how both ways have to be configured:
- How to: Configure Telerik Data Access Project For Offline Monitoring
- How to: Configure Telerik Data Access Project For Real-Time Monitoring
The topics in this section show how to work with the Telerik Data Access Profiler:
- How to: Configure Telerik Data Access Project For Offline Monitoring
- How to: Configure Telerik Data Access Project For Real-Time Monitoring
- How to: Configure Fluent Model For Monitoring
- How to: Detect and Solve N+1 Problems
- How to: Detect Long Running Queries
- How to: Detect Too Many Records Fetched Problems
- How to: Detect Runtime Exceptions
- How to: Detect Client-Side LINQ Queries
