Mark a Chart Series on Click
Environment
| Product | Chart for Blazor |
Description
I would like to mark a Chart Series on click by changing the color and opacity or to separate the clicked item from the rest.
Solution
You can use the ColorField and the ExplodeField (for pie-type charts) to visually distinguish the clicked series of the chart. In the handler for the OnSeriesClick event you should handle the color change and the toggling of the exploded field.
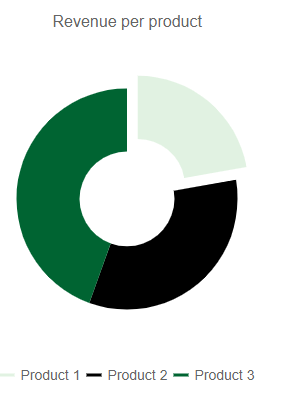
Mark a Chart Series On Click
@* Visually distinguish a clicked chart series *@

@using System.Text.RegularExpressions;

<TelerikChart OnSeriesClick="@OnSeriesClickHandler" Transitions="false">
    <ChartSeriesItems>
        <ChartSeries Type="@ChartSeriesType.Donut"
                     Data="@donutData"
                     Field="@nameof(MyDonutChartModel.SegmentValue)"
                     CategoryField="@nameof(MyDonutChartModel.SegmentName)"
                     ExplodeField="@nameof(MyDonutChartModel.isExploadedField)"
                     ColorField="@nameof(MyDonutChartModel.RGBAColor)">
        </ChartSeries>
    </ChartSeriesItems>

    <ChartTitle Text="Revenue per product"></ChartTitle>

    <ChartLegend Position="@ChartLegendPosition.Bottom">
    </ChartLegend>
</TelerikChart>

@code {
    void OnSeriesClickHandler(ChartSeriesClickEventArgs args)
    {
        string item = (args.DataItem as MyDonutChartModel).SegmentName;
        MyDonutChartModel dataModel = donutData.Where(x => x.SegmentName == item).FirstOrDefault();

        dataModel.isExploadedField = !dataModel.isExploadedField;

        //Apply your own coloring logic depending on the needs of the layout
        if (dataModel.isExploadedField)
        {
            dataModel.RGBAColor = dataModel.RGBAColor.Insert(dataModel.RGBAColor.LastIndexOf(")"), ", 0.2");
        }
        else
        {
            var match = Regex.Match(dataModel.RGBAColor, @",\s(\d\.\d)").Value;
            dataModel.RGBAColor = dataModel.RGBAColor.Replace(match, "");
        }
    }

    public class MyDonutChartModel
    {
        public string SegmentName { get; set; }
        public double SegmentValue { get; set; }
        public bool ShouldShowInLegend { get; set; } = true;
        public bool isExploadedField { get; set; }
        public string RGBAColor { get; set; }
    }

    public List<MyDonutChartModel> donutData = new List<MyDonutChartModel>
    {
        new MyDonutChartModel
        {
            SegmentName = "Product 1",
            SegmentValue = 2,
            isExploadedField = true,
            RGBAColor = $"rgba(104, 192, 108, 0.2)" // has initial opacity because it is already exploded (marked, separated)
        },
        new MyDonutChartModel
        {
            SegmentName = "Product 2",
            SegmentValue = 3,
            isExploadedField = false,
            RGBAColor = $"rgba(0, 0, 0)"
        },
        new MyDonutChartModel
        {
            SegmentName = "Product 3",
            SegmentValue = 4,
            isExploadedField = false,
            RGBAColor = $"rgba(0, 100, 50)"
        }
    };
}
The result of the code snippet above