Move the X-Axis Labels to the Bottom of the Chart
Environment
| Product | Chart for Blazor |
Description
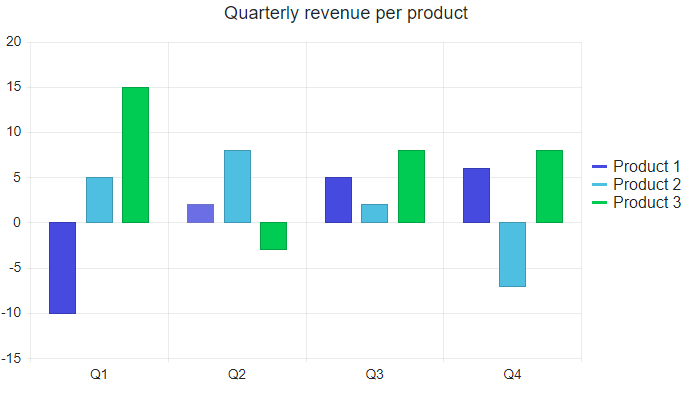
I am having a Chart with negative value. This causes the labels of the X-Axis to be overlapped by the chart series and make them unreadable.
I want the labels of my chart at the bottom so they aren't on top of the chart itself.
Labels overlapped by the chart series. Problematic example.
Solution
You can control the point where the axes cross each other by using the AxisCrossingValue parameter. To move the labels of the x-axis to the bottom of the Chart you have to set a very low value of the AxisCrossingValue parameter for the y-axis (ChartValueAxis).
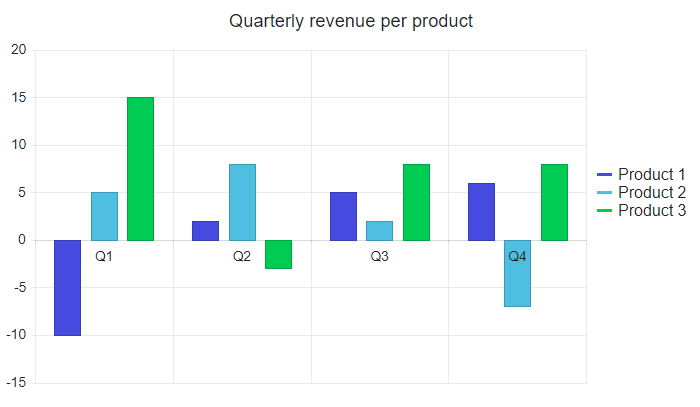
Move the X-Axis labels to the bottom of the Chart
@* This example shows how to move the X-Axis labels to the bottom of the Chart by setting the AxisCrossingValue to a low value *@

<TelerikChart Width="700px">
    <ChartValueAxes>
        <ChartValueAxis AxisCrossingValue="@crossingValues"></ChartValueAxis>
    </ChartValueAxes>

    <ChartSeriesItems>
        <ChartSeries Type="ChartSeriesType.Column" Name="Product 1" Data="@series1Data">
            <ChartSeriesStack Enabled="true" Group="separateGroup1"></ChartSeriesStack>
        </ChartSeries>
        <ChartSeries Type="ChartSeriesType.Column" Name="Product 2" Data="@series2Data">
            <ChartSeriesStack Enabled="true" Group="separateGroup2"></ChartSeriesStack>
        </ChartSeries>
        <ChartSeries Type="ChartSeriesType.Column" Name="Product 3" Data="@series3Data">
            <ChartSeriesStack Enabled="true" Group="separateGroup3"></ChartSeriesStack>
        </ChartSeries>
    </ChartSeriesItems>

    <ChartCategoryAxes>
        <ChartCategoryAxis Categories="@categories"></ChartCategoryAxis>
    </ChartCategoryAxes>

    <ChartTitle Text="Quarterly revenue per product"></ChartTitle>
    <ChartLegend Position="ChartLegendPosition.Right">
    </ChartLegend>
</TelerikChart>

@code {
    // very low value for the crossing value moves the axis to the bottom of the Chart
    public object[] crossingValues = new object[] { int.MinValue };

    public List<object> series1Data = new List<object>() { -10, 2, 5, 6 };
    public List<object> series2Data = new List<object>() { 5, 8, 2, -7 };
    public List<object> series3Data = new List<object>() { 15, -3, 8, 8 };
    public string[] categories = new string[] { "Q1", "Q2", "Q3", "Q4" };
}
The result from the code snippet above