Data table in the chart
Environment
| Product | Chart for Blazor |
Description
Is there an easy way to put the data table below the chart? Chart with data table. How to add a data table to the Chart?
Solution
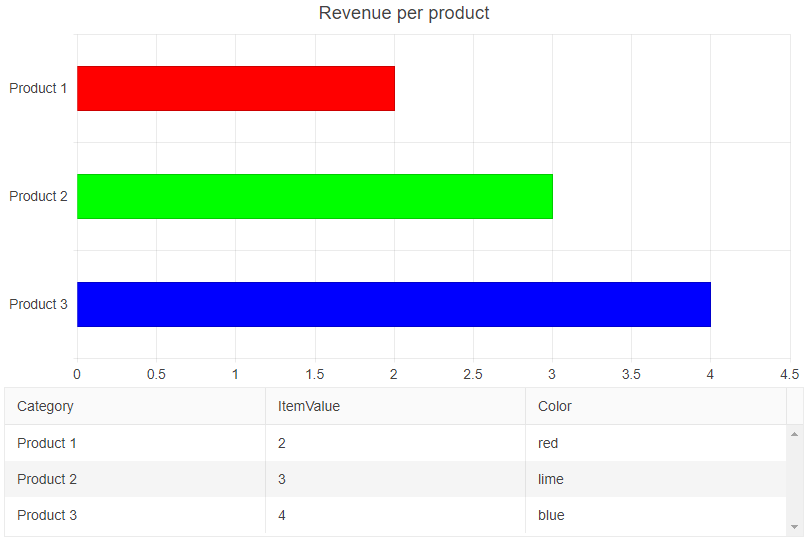
You can use Grid for data table below the Chart. By using the same data from the Chart in the Grid below it, you can achieve the desired result.
Added Grid in the role of data table below the Chart. The result from the snippet below.
@*This chart is using Grid for thr role of data table*@

<TelerikChart Height="400px" Width="800px">
    <ChartSeriesItems>
        <ChartSeries Type="ChartSeriesType.Bar" Data="@theData" ColorField="@nameof(MyChartDataModel.Color)"
                     Field="@nameof(MyChartDataModel.ItemValue)" CategoryField="@nameof(MyChartDataModel.Category)" />
    </ChartSeriesItems>
    <ChartTitle Text="Revenue per product" />
    <ChartLegend Position="ChartLegendPosition.Right" />
</TelerikChart>
<TelerikGrid Data="@theData" Height="150px" Width="800px">
    <GridColumns>
        <GridColumn Field="@(nameof(MyChartDataModel.Category))" />
        <GridColumn Field="@(nameof(MyChartDataModel.ItemValue))" />
        <GridColumn Field="@(nameof(MyChartDataModel.Color))" />
    </GridColumns>
</TelerikGrid>

@code {
    public class MyChartDataModel
    {
        public string Category { get; set; }
        public double ItemValue { get; set; }
        public string Color { get; set; }
    }

    public List<MyChartDataModel> theData = new List<MyChartDataModel>
    {
        new MyChartDataModel
        {
            Category = "Product 1",
            ItemValue = 2,
            Color = "red"
        },
        new MyChartDataModel
        {
            Category = "Product 2",
            ItemValue = 3,
            Color = "lime"
        },
        new MyChartDataModel
        {
            Category = "Product 3",
            ItemValue = 4,
            Color = "blue"
        }
    };
}