Polar Charts
The Telerik UI Polar Chart HtmlHelper for ASP.NET MVC is a server-side wrapper for the Kendo UI for jQuery Polar Chart widget.
The Polar Charts display the data in a circular coordinate system, where each data point is represented by the distance from the center of the coordinate system (the pole) and the angle from the fixed direction (the angular coordinate).
Getting Started
Polar Charts are suitable for visualizing data that has a cyclical nature or is related to radiuses and angles. For example, scientific data like precipitation or heat distribution across the Earth's poles and other multivariate data in a circular layout.
The Polar Charts can be categorized into the following types:
- Polar Line—Represents the series as curves that connect points.
- Smooth Polar Line—Visualizes the series as smooth curves.
- Polar Scatter—Displays plots that represent non-connected data points.
- Polar Area—Shows the data points connected with straight line segments that enclose a filled area together with the chart pole.
To customize the default chart axes, explore the various options available through the XAxis and YAxis configurations.
Also, you can bind the Polar Chart to inline, local, and remote data. For more information on the available data binding approaches, refer to the Charts Data Binding Overview.
Polar Line Charts
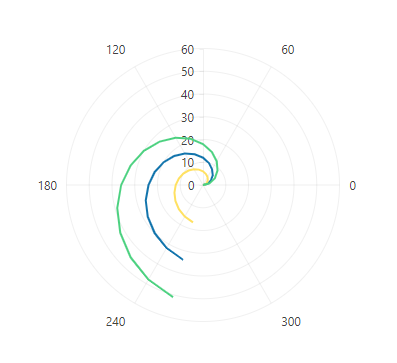
To create a Polar Line Chart, add each collection of data points to the PolarLine() option of the Series configuration. The following example shows how to define a Polar Line Chart with three series.
    @(Html.Kendo().Chart()
        .Name("chart")
        .Series(series => {
            series.PolarLine(new int[][] {
                new int[] {0, 0}, new int[] {15, 2}, new int[] {30, 4},
                new int[] {45, 6}, new int[] {60, 8}, new int[] {75, 10},
                new int[] {90, 12}, new int[] {105, 14}, new int[] {120, 16},
                new int[] {135, 18}, new int[] {150, 20}, new int[] {165, 22},
                new int[] {180, 24}, new int[] {195, 26}, new int[] {210, 28},
                new int[] {225, 30}, new int[] {240, 32}, new int[] {255, 34}
            });

            series.PolarLine(new int[][] {
                new int[] {0, 0}, new int[] {15, 1}, new int[] {30, 2},
                new int[] {45, 3}, new int[] {60, 4}, new int[] {75, 5},
                new int[] {90, 6}, new int[] {105, 7}, new int[] {120, 8},
                new int[] {135, 9}, new int[] {150, 10}, new int[] {165, 11},
                new int[] {180, 12}, new int[] {195, 13}, new int[] {210, 14},
                new int[] {225, 15}, new int[] {240, 16}, new int[] {255, 17}
            });

            series.PolarLine(new int[][] {
                new int[] {0, 0}, new int[] {15, 3}, new int[] {30, 6},
                new int[] {45, 9}, new int[] {60, 12}, new int[] {75, 15},
                new int[] {90, 18}, new int[] {105, 21}, new int[] {120, 24},
                new int[] {135, 27}, new int[] {150, 30}, new int[] {165, 33},
                new int[] {180, 36}, new int[] {195, 39}, new int[] {210, 42},
                new int[] {225, 45}, new int[] {240, 48}, new int[] {255, 51}
            });
        })
    )
The configuration from the example results in the following Polar Chart.

Smooth Polar Line Charts
By default, the data points in the Polar Line Chart are connected with a straight line. To display a smooth line, use the Style(ChartSeriesStyle.Smooth) setting of the Series configuration.
    // Setting the line style to "smooth" for the first series only.
    @(Html.Kendo().Chart()
        .Name("smoothPolarLineChart1")
        .Series(series => {
            series.PolarLine(new int[][] {
                new int[] {0, 0}, new int[] {15, 2}, new int[] {30, 4},
                new int[] {45, 6}, new int[] {60, 8}, new int[] {75, 10},
                new int[] {90, 12}, new int[] {105, 14}, new int[] {120, 16},
                new int[] {135, 18}, new int[] {150, 20}, new int[] {165, 22},
                new int[] {180, 24}, new int[] {195, 26}, new int[] {210, 28},
                new int[] {225, 30}, new int[] {240, 32}, new int[] {255, 34}
            })
            .Style(ChartSeriesStyle.Smooth);

            series.PolarLine(new int[][] {
                new int[] {0, 0}, new int[] {15, 1}, new int[] {30, 2},
                new int[] {45, 3}, new int[] {60, 4}, new int[] {75, 5},
                new int[] {90, 6}, new int[] {105, 7}, new int[] {120, 8},
                new int[] {135, 9}, new int[] {150, 10}, new int[] {165, 11},
                new int[] {180, 12}, new int[] {195, 13}, new int[] {210, 14},
                new int[] {225, 15}, new int[] {240, 16}, new int[] {255, 17}
            });
        })
    )

    // Setting the line style to "smooth" in the default series settings (it will be applied for all series).
    @(Html.Kendo().Chart()
        .Name("smoothPolarLineChart2")
        .SeriesDefaults(seriesDefaults => seriesDefaults
            .PolarLine()
            .Style(ChartSeriesStyle.Smooth)
        )
        .Series(series => {
            series.PolarLine(new int[][] {
                new int[] {0, 0}, new int[] {15, 2}, new int[] {30, 4},
                new int[] {45, 6}, new int[] {60, 8}, new int[] {75, 10},
                new int[] {90, 12}, new int[] {105, 14}, new int[] {120, 16},
                new int[] {135, 18}, new int[] {150, 20}, new int[] {165, 22},
                new int[] {180, 24}, new int[] {195, 26}, new int[] {210, 28},
                new int[] {225, 30}, new int[] {240, 32}, new int[] {255, 34}
            });

            series.PolarLine(new int[][] {
                new int[] {0, 0}, new int[] {15, 1}, new int[] {30, 2},
                new int[] {45, 3}, new int[] {60, 4}, new int[] {75, 5},
                new int[] {90, 6}, new int[] {105, 7}, new int[] {120, 8},
                new int[] {135, 9}, new int[] {150, 10}, new int[] {165, 11},
                new int[] {180, 12}, new int[] {195, 13}, new int[] {210, 14},
                new int[] {225, 15}, new int[] {240, 16}, new int[] {255, 17}
            });
        })
    )
Polar Scatter Charts
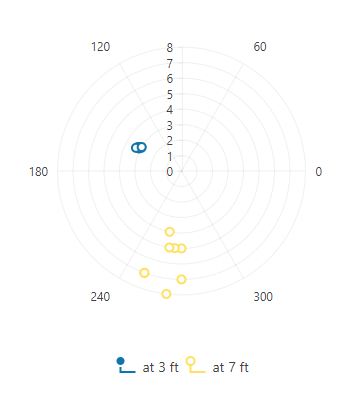
When you want to display non-connected data points, create a Polar Scatter Chart by adding each data points collection to the PolarScatter() option of the Series configuration.
    @(Html.Kendo().Chart()
        .Name("chart")
        .Legend(legend => legend
            .Position(ChartLegendPosition.Bottom)
        )
        .Series(series => {
            series.PolarScatter(new double[][] {
                new double[] {150, 3}, new double[] {150, 3.1},
                new double[] {152, 3.2}, new double[] {152, 3.1},
                new double[] {151, 3.2}, new double[] {153, 3.3},
                new double[] {149, 3}
            })
            .Name("at 3 ft");

            series.PolarScatter(new double[][] {
                new double[] {270, 5}, new double[] {250, 7},
                new double[] {259, 4}, new double[] {270, 7},
                new double[] {265, 5}, new double[] {250, 7},
                new double[] {263, 8}, new double[] {261, 5}
            })
            .Name("at 7 ft");
        })
    )
The configuration from the example results in the following Polar Chart.

Polar Area Charts
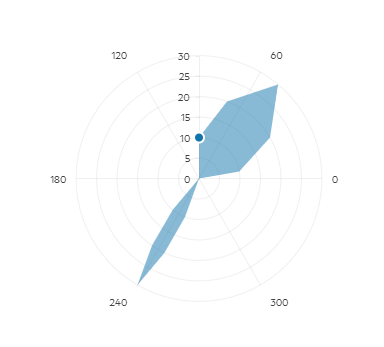
Another variation of the Polar Chart is the Polar Area Chart, which represents the data points connected with straight line segments that enclose a filled area, extending from these points to the chart's central pole. As a result, the chart highlights the relative proportions of different data series within a single circular plot.
To create a Polar Area Chart, use the PolarArea() option of the Series configuration.
    @(Html.Kendo().Chart()
        .Name("chart")
        .Legend(legend => legend
            .Position(ChartLegendPosition.Bottom)
        )
        .Series(series => {
            series.PolarArea(new double[][] {
                new double[] {10, 10}, new double[] {30, 20},
                new double[] {50, 30}, new double[] {70, 20},
                new double[] {90, 10}, new double[] {90, 0},
                new double[] {230, 10}, new double[] {235, 20},
                new double[] {240, 30}, new double[] {245, 20},
                new double[] {250, 10}
            });
        })
    )
The configuration from the example results in the following Polar Chart.

Configuring the Axes
The Polar Chart contains X and Y-axes. You can configure both axes through the XAxis() and YAxis() configurations.
The following example shows how to set a specified start angle (degrees) for the X-axis and hide the labels of the Y-axis of a Polar Line Chart.
    @(Html.Kendo().Chart()
        .Name("chart")
        .XAxis(axis => axis
            .Polar()
            .StartAngle(-90)
        )
        .YAxis(axis => axis
            .Polar()
            .Labels(labels => labels
                .Visible(false)
            )
        )
        .Series(series => {
            series.PolarLine(new int[][] {
                new int[] {0, 0}, new int[] {15, 2}, new int[] {30, 4},
                new int[] {45, 6}, new int[] {60, 8}, new int[] {75, 10},
                new int[] {90, 12}, new int[] {105, 14}, new int[] {120, 16},
                new int[] {135, 18}, new int[] {150, 20}, new int[] {165, 22},
                new int[] {180, 24}, new int[] {195, 26}, new int[] {210, 28},
                new int[] {225, 30}, new int[] {240, 32}, new int[] {255, 34}
            });

            series.PolarLine(new int[][] {
                new int[] {0, 0}, new int[] {15, 1}, new int[] {30, 2},
                new int[] {45, 3}, new int[] {60, 4}, new int[] {75, 5},
                new int[] {90, 6}, new int[] {105, 7}, new int[] {120, 8},
                new int[] {135, 9}, new int[] {150, 10}, new int[] {165, 11},
                new int[] {180, 12}, new int[] {195, 13}, new int[] {210, 14},
                new int[] {225, 15}, new int[] {240, 16}, new int[] {255, 17}
            });

            series.PolarLine(new int[][] {
                new int[] {0, 0}, new int[] {15, 3}, new int[] {30, 6},
                new int[] {45, 9}, new int[] {60, 12}, new int[] {75, 15},
                new int[] {90, 18}, new int[] {105, 21}, new int[] {120, 24},
                new int[] {135, 27}, new int[] {150, 30}, new int[] {165, 33},
                new int[] {180, 36}, new int[] {195, 39}, new int[] {210, 42},
                new int[] {225, 45}, new int[] {240, 48}, new int[] {255, 51}
            });
        })
    )