Stacked Bar Chart
A Stacked bar is a bar divided into subparts to show cumulative effect, to display money distribution or production against time. This implementation provides the opportunity to represent the total value for a stack by given category. In the same time the subcategories are represented in the same stack. You can easily enable the stack feature through the SeriesDefaults -> Bar -> Stack(true) setting.
The following implementation demonstrates the code needed for setting the Stacked Bar Chart:
@(Html.Kendo().Chart()
.Name("chart")
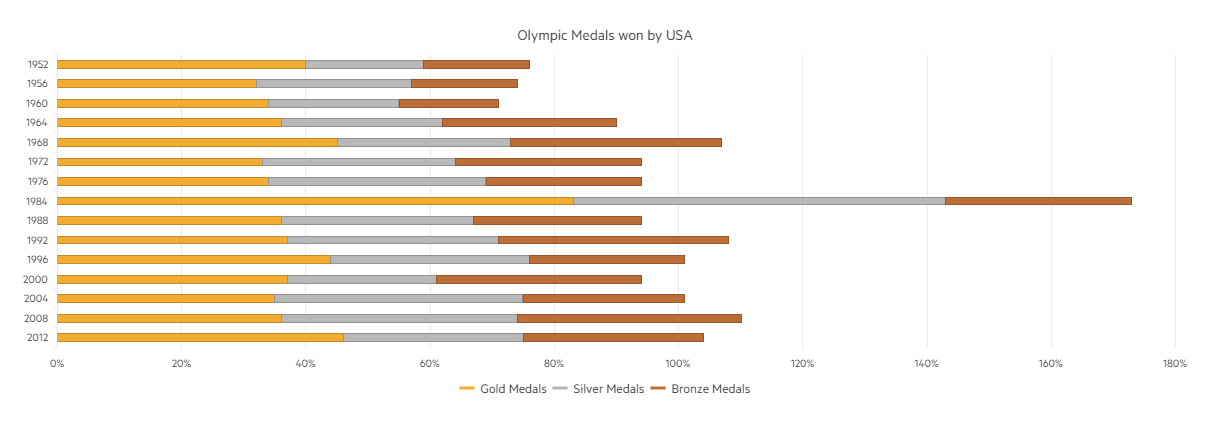
.Title("Olympic Medals won by USA")
.Legend(legend => legend
.Position(ChartLegendPosition.Bottom)
)
.SeriesDefaults(seriesDefaults =>
seriesDefaults.Bar().Stack(true)
)
.Series(series => {
series.Bar(new double[] { 40, 32, 34, 36, 45, 33, 34, 83, 36, 37, 44, 37, 35, 36, 46 }).Name("Gold Medals").Color("#f3ac32");
series.Bar(new double[] { 19, 25, 21, 26, 28, 31, 35, 60, 31, 34, 32, 24, 40, 38, 29 }).Name("Silver Medals").Color("#b8b8b8");
series.Bar(new double[] { 17, 17, 16, 28, 34, 30, 25, 30, 27, 37, 25, 33, 26, 36, 29 }).Name("Bronze Medals").Color("#bb6e36");
})
.CategoryAxis(axis => axis
.Categories("1952", "1956", "1960", "1964", "1968", "1972", "1976", "1984", "1988", "1992", "1996", "2000", "2004", "2008", "2012")
.MajorGridLines(lines => lines.Visible(false))
)
.ValueAxis(axis => axis
.Numeric()
.Labels(labels => labels.Format("{0}%"))
.Max(180)
.Line(line => line.Visible(false))
.MajorGridLines(lines => lines.Visible(true))
)
.Tooltip(tooltip => tooltip
.Visible(true)
.Template("#= series.name #: #= value #")
)
)
Overview of the Stacked Bars: