Logarithmic Axis
A logarithmic axis is a special numeric axis that transforms the actual values by using a logarithmic function with a particular base. A logarithmic axis is useful for displaying values that cover different orders of magnitude because it lets large values display together with small values in a more condensed scale than the default linear axis.
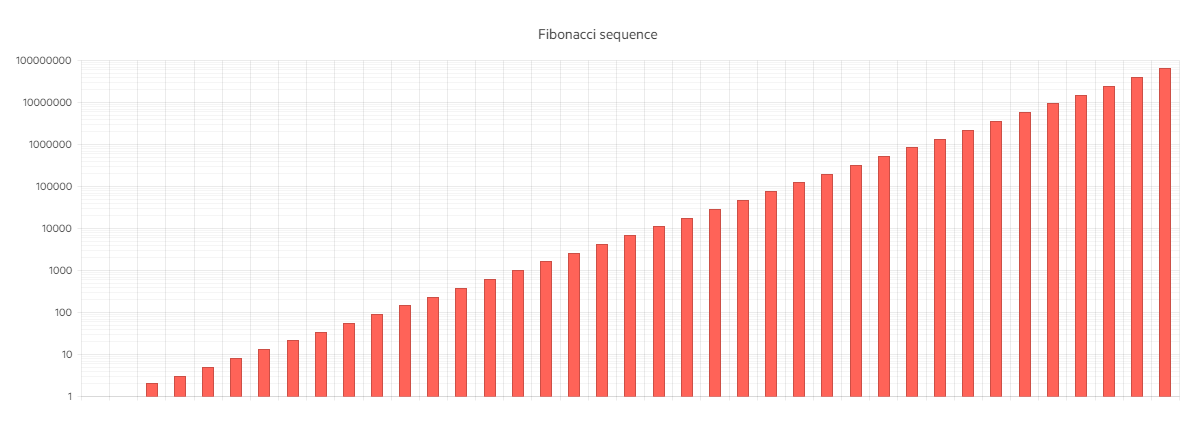
This demo shows how you can use a logarithmic axis for the ASP.NET Core Column Chart by setting the ValueAxis -> Logarithmic() method.
The following implementation demonstrates the code needed for setting the Date Axis for Bar Chart:
 @model IEnumerable<int>

<div class="demo-section k-content wide">
    @(Html.Kendo().Chart()
        .Name("chart")
        .Title("Fibonacci sequence")
        .Series(series => {
            series.Column(Model);
        })
        .ValueAxis(axis => axis.Logarithmic()
            .MinorGridLines(minorGridLines => minorGridLines.Visible(true))
        )
        .Tooltip(tooltip => tooltip
            .Visible(true)
        )
    )
</div>
 public partial class Bar_ChartsController : Controller
    {
        [Demo]
        public ActionResult Logarithmic_Axis()
        {
            return View(GetFibonacciSequence(39));
        }

        private List<int> GetFibonacciSequence(int n)
        {
            var sequence = new List<int>() { 1, 1 };
            for (var i = 2; i < n; i++)
            {
                sequence.Add(sequence[i - 1] + sequence[i - 2]);
            }

            return sequence;
        }
    }
Overview of setting the Logarithmic Axis representing the Fibonacci Sequence: