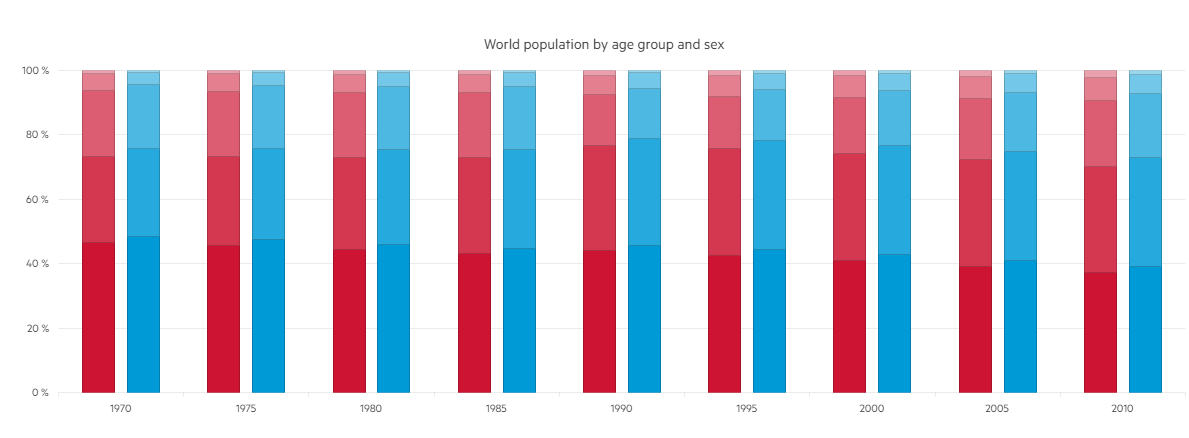
100% Stacked and Grouped Bars
The Kendo UI Bar Chart supports 100% stacking that could be grouped in the same time. This implementation provides the opportunity to represent 100% stacked Bar Charts divided by groups of categories.
You can enable the 100% stack feature by setting the first ChartStackType.Stack100 argument of the Series -> Column -> Stack() method, i.e.
series.Column(new int[] { 1100941, 1139797, 1172929, 1184435, 1184654 }).Name("0-19").Stack(ChartStackType.Stack100, "Female");
The following implementation demonstrates the code needed for setting the 100% Stacked and Grouped Bar Chart:
  @(Html.Kendo().Chart()
        .Name("chart")
        .Title("World population by age group and sex")
        .Legend(legend => legend
            .Visible(false)
        )
        .Series(series => {
            series
                .Column(new int[] { 854622, 925844, 984930, 1044982, 1100941, 1139797, 1172929, 1184435, 1184654 })
                .Name("0-19").Stack(ChartStackType.Stack100, "Female");

            series
                .Column(new int[] { 490550, 555695, 627763, 718568, 810169, 883051, 942151, 1001395, 1058439 })
                .Name("20-39").Stack(ChartStackType.Stack100, "Female");

            series
                .Column(new int[] { 379788, 411217, 447201, 484739, 395533, 435485, 499861, 569114, 655066 })
                .Name("40-64").Stack(ChartStackType.Stack100, "Female");

            series
                .Column(new int[] { 97894, 113287, 128808, 137459, 152171, 170262, 191015, 210767, 226956 })
                .Name("65-79").Stack(ChartStackType.Stack100, "Female");

            series
                .Column(new int[] { 16358, 18576, 24586, 30352, 36724, 42939, 46413, 54984, 66029 })
                .Name("80+").Stack(ChartStackType.Stack100, "Female");

            series
                .Column(new int[] { 900268, 972205, 1031421, 1094547, 1155600, 1202766, 1244870, 1263637, 1268165 })
                .Name("0-19").Stack(ChartStackType.Stack100, "Male");

            series
                .Column(new int[] { 509133, 579487, 655494, 749511, 844496, 916479, 973694, 1036548, 1099507 })
                .Name("20-39").Stack(ChartStackType.Stack100, "Male");

            series
                .Column(new int[] { 364179, 401396, 440844, 479798, 390590, 430666, 495030, 564169, 646563 })
                .Name("40-64").Stack(ChartStackType.Stack100, "Male");

            series
                .Column(new int[] { 74208, 86516, 98956, 107352, 120614, 138868, 158387, 177078, 192156 })
                .Name("65-79").Stack(ChartStackType.Stack100, "Male");

            series
                .Column(new int[] { 9187, 10752, 13007, 15983, 19442, 23020, 25868, 31462, 39223 })
                .Name("80+").Stack(ChartStackType.Stack100, "Male");
        })
        .SeriesColors(
            "#cd1533", "#d43851", "#dc5c71", "#e47f8f", "#eba1ad",
            "#009bd7", "#26aadd", "#4db9e3", "#73c8e9", "#99d7ef"
        )
        .CategoryAxis(axis => axis
            .Categories("1970", "1975", "1980", "1985", "1990", "1995", "2000", "2005", "2010")
            .MajorGridLines(lines => lines.Visible(false))
        )
        .ValueAxis(axis => axis
            .Numeric()
            .Line(line => line.Visible(false))
        )
        .Tooltip(tooltip => tooltip
            .Visible(true)
            .Template("#= series.stack.group #s, age #= series.name #")
        )
    )
Overview of the 100% Stacked and Grouped Bars: