Tooltip
The Telerik UI Chart enables you to display details about the data point over which the mouse is currently hovering.
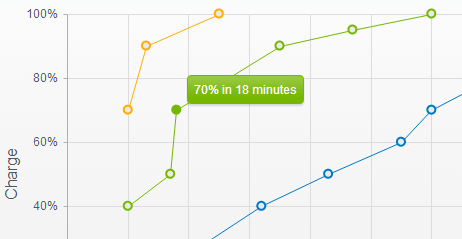
The border of this tooltip matches the color of the series.
Getting Started
By default, the tooltip of the Chart is not visible. You can enable it by setting the visible property of the tooltip object to true.
    @(Html.Kendo().Chart()
        .Name("chart")
        .Series(s => s
            .Bar(new double[] { 67.96, 68.93, 75, 74, 78 })
        )
        .CategoryAxis(c => c
            .Categories(new string[] { "2005", "2006", "2007", "2008", "2009" })
        )
        .Tooltip(t => t.Visible(true))
    )
    @{
        var categories = new string[] { "2005", "2006", "2007", "2008", "2009" };
    }

    <kendo-chart name="chart">
        <category-axis>
            <category-axis-item categories="categories">
            </category-axis-item>
        </category-axis>
        <tooltip visible="true"></tooltip>
        <!-- Other options.-->
    </kendo-chart>
The tooltip can also be configured per series.
    .Series(s => s
        .Bar(new double[] { 67.96, 68.93, 75, 74, 78 })
        .Tooltip(t=>t.Visible(true))
    )
    @{
        var series_data = new double[] { 67.96, 68.93, 75, 74, 78 };
    }

    <series>
        <series-item type="ChartSeriesType.Bar" data="series_data">
            <tooltip visible="true"/>
        </series-item>
    </series>
Using Format Values
To format the point value, use the Format property. In the following example, N0 indicates that the value will be rounded to a whole number and will have a thousands separator.
Points in categorical (XY) Charts have two values—
{0}and{1}(X and Y).
    .Tooltip(t => t
        .Visible(true)
        .Format("Value: {0:N0}")
    )
<tooltip visible="true" format="Value: {0:N0}"></tooltip>
Using Templates
To provide better flexibility, define the content of a tooltip through a template.
The template provides access to all information associated with the point:
-
value—The point value. Value dimensions are available as properties, for example,value.xandvalue.y. -
category—The category name. -
series—The data series. - (When binding to a data source)
dataItem—The original data item.
    .Tooltip(t => t
        .Visible(true)
        .Template("Value: #= value # ; Category: #= category #")
    )
<tooltip visible="true" template="Value: #= value # ; Category: #= category #"></tooltip>
You can also use an external template by specifying TemplateId.
    .Tooltip(t => t
        .Visible(true)
        .TemplateId("tooltipTemplate")
    )
<tooltip visible="true" template-id="tooltipTemplate"></tooltip>
    <script id="tooltipTemplate" type="text/x-kendo-template">
        Value: #= value # ; Category: #= category #
    </script>