Date Series
You can control the display of dates in the Telerik UI Chart for ASP.NET Core.
Date Series in Categorical Charts
Categorical charts and other Telerik UI chart types provide built-in support for displaying dates, including the following scenarios:
- Automatic selection of granularity or base unit (minutes, hours, days, and so on).
- Label formatting that is matched to the granularity.
- Grouping of categories into base units and series aggregates.
Specifying categories of type Date switches the axis to a date mode. The automatic mode selection can be overridden by setting CategoryAxis.Type to ChartCategoryAxisType.Date.
Date Binding
To bind the date series, use CategoryField. The categories (dates) for all series are sorted and merged during data binding.
Date Grouping
If the series contain two or more values for a specific period (base unit), they are aggregated to display a single value.
The dates have to match the source.
    @(Html.Kendo().Chart()
        .Name("chart")
        .Series(s => s
            .Column(new List<StockDataPoint>() { new StockDataPoint {
                    Date = new DateTime(2011,12,30),
                    Volume = 20
                },
                new StockDataPoint {
                    Date = new DateTime(2011,12,31),
                    Volume = 40
                },
                new StockDataPoint {
                    Date = new DateTime(2012,1,1),
                    Volume = 45
                },
                new StockDataPoint {
                    Date = new DateTime(2012,1,2),
                    Volume = 30
                },
                new StockDataPoint {
                    Date = new DateTime(2012,1,3),
                    Volume = 50
                } })
            .Field("Volume")
            .CategoryField("Date")
        )
        .CategoryAxis(categoryAxis => categoryAxis.Type(ChartCategoryAxisType.Date) )
    )
    @addTagHelper *, Kendo.Mvc

    @{
        var column_data = new List<StockDataPoint>() {
            new StockDataPoint {
                Date = new DateTime(2011,12,30),
                Volume = 20
            },
            new StockDataPoint {
                Date = new DateTime(2011,12,31),
                Volume = 40
            },
            new StockDataPoint {
                Date = new DateTime(2012,1,1),
                Volume = 45
            },
            new StockDataPoint {
                Date = new DateTime(2012,1,2),
                Volume = 30
            },
            new StockDataPoint {
                Date = new DateTime(2012,1,3),
                Volume = 50
            }
        };
    }

    <kendo-chart name="chart">
        <series>
            <series-item type="ChartSeriesType.Column" data="column_data" field="Volume" category-field="Date">
            </series-item>
        </series>
        <category-axis>
            <category-axis-item type="ChartCategoryAxisType.Date"></category-axis-item>
        </category-axis>
    </kendo-chart>
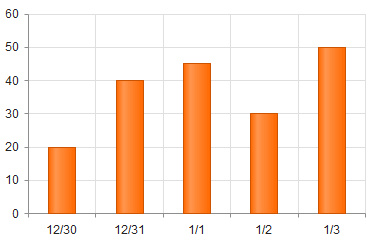
The following image demonstrates a chart with a set date category axis.
The following example demonstrates date series that are grouped by the year.
    @(Html.Kendo().Chart()
        .Name("chart")
        .Series(s => s
            .Column(new List<StockDataPoint>() { new StockDataPoint {
                    Date = new DateTime(2011,12,30),
                    Volume = 20
                },
                new StockDataPoint {
                    Date = new DateTime(2011,12,31),
                    Volume = 40
                },
                new StockDataPoint {
                    Date = new DateTime(2012,1,1),
                    Volume = 45
                },
                new StockDataPoint {
                    Date = new DateTime(2012,1,2),
                    Volume = 30
                },
                new StockDataPoint {
                    Date = new DateTime(2012,1,3),
                    Volume = 50
                } })
            .Field("Volume")
            .CategoryField("Date")
        )
        .CategoryAxis(categoryAxis => categoryAxis.Type(ChartCategoryAxisType.Date).BaseUnit(ChartAxisBaseUnit.Years) )
    )
    @addTagHelper *, Kendo.Mvc

    @{
        var column_data = new List<StockDataPoint>() {
            new StockDataPoint {
                Date = new DateTime(2011,12,30),
                Volume = 20
            },
            new StockDataPoint {
                Date = new DateTime(2011,12,31),
                Volume = 40
            },
            new StockDataPoint {
                Date = new DateTime(2012,1,1),
                Volume = 45
            },
            new StockDataPoint {
                Date = new DateTime(2012,1,2),
                Volume = 30
            },
            new StockDataPoint {
                Date = new DateTime(2012,1,3),
                Volume = 50
            }
        };
    }

    <kendo-chart name="chart">
        <series>
            <series-item type="ChartSeriesType.Column" data="column_data" field="Volume" category-field="Date">
            </series-item>
        </series>
        <category-axis>
            <category-axis-item type="ChartCategoryAxisType.Date" base-unit="ChartAxisBaseUnit.Years"></category-axis-item>
        </category-axis>
    </kendo-chart>
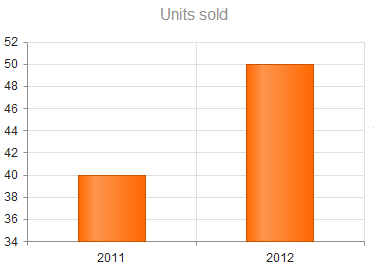
The following image displays a chart with a grouped date category axis. Note how the maximum value for each year is now displayed.
Setting Aggregates
You can set an aggregate type for each series.
The following options are available:
Min- (Default)
Max CountSumAvgFirstSumOrNull
The following example demonstrates how to handle date grouping with the sum aggregate.
    @(Html.Kendo().Chart()
        .Name("chart")
        .Series(s => s
            .Column(new List<StockDataPoint>() { new StockDataPoint {
                    Date = new DateTime(2011,12,30),
                    Volume = 20
                },
                new StockDataPoint {
                    Date = new DateTime(2011,12,31),
                    Volume = 40
                },
                new StockDataPoint {
                    Date = new DateTime(2012,1,1),
                    Volume = 45
                },
                new StockDataPoint {
                    Date = new DateTime(2012,1,2),
                    Volume = 30
                },
                new StockDataPoint {
                    Date = new DateTime(2012,1,3),
                    Volume = 50
                } })
            .Field("Volume")
            .CategoryField("Date")
            .Aggregate(ChartSeriesAggregate.Sum)
        )
        .CategoryAxis(categoryAxis => categoryAxis.BaseUnit(ChartAxisBaseUnit.Years).Type(ChartCategoryAxisType.Date) )
    )
    @addTagHelper *, Kendo.Mvc

    @{
        var column_data = new List<StockDataPoint>() {
            new StockDataPoint {
                Date = new DateTime(2011,12,30),
                Volume = 20
            },
            new StockDataPoint {
                Date = new DateTime(2011,12,31),
                Volume = 40
            },
            new StockDataPoint {
                Date = new DateTime(2012,1,1),
                Volume = 45
            },
            new StockDataPoint {
                Date = new DateTime(2012,1,2),
                Volume = 30
            },
            new StockDataPoint {
                Date = new DateTime(2012,1,3),
                Volume = 50
            }
        };
    }

    <kendo-chart name="chart">
        <series>
            <series-item type="ChartSeriesType.Column" data="column_data" field="Volume" category-field="Date" aggregate="ChartSeriesAggregate.Sum">
            </series-item>
        </series>
        <category-axis>
            <category-axis-item type="ChartCategoryAxisType.Date" base-unit="ChartAxisBaseUnit.Years"></category-axis-item>
        </category-axis>
    </kendo-chart>
Setting Base Units
To set the base units in the categorical charts, use any of the following approaches:
Default Configuration
To determine a default base, use the smallest duration between categories.
    .CategoryAxis(categoryAxis => categoryAxis
        .Categories(new DateTime[] {new DateTime(2005, 1, 1), new DateTime(2006, 1, 1) })
        // baseUnit is set to "years".
    )
    @{
        var categories_data = new DateTime[] { new DateTime(2005, 1, 1), new DateTime(2006, 1, 2) };
    }

    // baseUnit is set to "years".
    <category-axis>
        <category-axis-item categories="categories_data"></category-axis-item>
    </category-axis>
    .CategoryAxis(categoryAxis => categoryAxis
        .Categories(new DateTime[] {new DateTime(2005, 1, 1), new DateTime(2005, 1, 2) })
        // baseUnit is set to "days".
    )
    @{
        var categories_data = new DateTime[] { new DateTime(2005, 1, 1), new DateTime(2005, 1, 2) };
    }

    // baseUnit is set to "days".
    <category-axis>
        <category-axis-item categories="categories_data"></category-axis-item>
    </category-axis>
Manual Configuration
You can also manually specify the BaseUnit. To display every nth base unit, set the BaseUnitStep option.
The following options are valid for ChartAxisBaseUnit:
- Seconds
- Minutes
- Hours
- Days
- Weeks
- Months
- Years
- Fit
Automatic Fitting
Setting the BaseUnit to ChartAxisBaseUnit.Fit constrains the total number of base units to MaxDateGroups. The BaseUnit and BaseUnitStep are selected according to the AutoBaseUnitSteps.
    @(Html.Kendo().Chart()
        .Name("chart")
        .Series(s => s
            .Line(new List<StockDataPoint>() {
                new StockDataPoint {
                    Date = new DateTime(2012,1,2),
                    Volume = 30
                },
                new StockDataPoint {
                    Date = new DateTime(2012,2,1),
                    Volume = 50
                } })
            .Field("Volume")
            .CategoryField("Date")
        )
        .CategoryAxis(categoryAxis=> categoryAxis
            .BaseUnit(ChartAxisBaseUnit.Fit)
            .MaxDateGroups(5)
            .AutoBaseUnitSteps(unitSteps => unitSteps
                .Days(new int[] { 1 }) // Would produce 31 groups => Skip to weeks.
                .Weeks(new int[] { }) // Not allowed as no steps are defined => Skip to months.
                .Months(new int[] { 1 }) // Results in 2 groups => Chosen.
            ))
    )
    @addTagHelper *, Kendo.Mvc

    @{
        var line_data = new List<StockDataPoint>() {
            new StockDataPoint {
                    Date = new DateTime(2012,1,2),
                    Volume = 30
            },
            new StockDataPoint {
                Date = new DateTime(2012,2,1),
                Volume = 50
            }
        };
    }

    <kendo-chart name="chart">
        <series>
            <series-item type="ChartSeriesType.Line" data="line_data" field="Volume" category-field="Date">
            </series-item>
        </series>
        <category-axis>
            <category-axis-item base-unit="ChartAxisBaseUnit.Fit" max-date-groups="5">
                <auto-base-unit-steps days="new int[] { 1 }" weeks="new int[] { }" months="new int[] { 1 }"/>
            </category-axis-item>
        </category-axis>
    </kendo-chart>
Labels Format
The date category axis provides options for specifying one format per base unit. If specified, the Labels.Format property takes priority. The global culture is used for formatting the dates and can be overridden by setting the Labels.Culture property.
    .CategoryAxis(categoryAxis => categoryAxis
        .Labels(labels => labels
            .DateFormats(dateFormat => dateFormat.Days("M/d"))
        )
    )
    <category-axis>
        <category-axis-item>
            <labels>
                <chart-category-axis-labels-date-formats days="M/d"/>
            </labels>
        </category-axis-item>
    </category-axis>
Date Series in Scatter Charts
Scatter charts provide built-in support for displaying dates, including:
- Automatic selection of granularity or base unit (minutes, hours, days, and so on).
- Label formatting that is matched to the granularity.
If the series values are of type Date, the X and Y axes switch into date mode. To override the automatic mode selection, specify type: "Date".
The following options accept dates:
The following options are expressed in base units:
Setting Base Units
To set the base units in the scatter charts, use any of the following approaches:
Default Configuration
The default base unit is determined by the axis (or series) range.
    .XAxis(xAxis => xAxis
        .Min(new DateTime(2005,1,1))
        .Max(new DateTime(2006,1,1))
        // baseUnit is set to "years"
    )
    <x-axis>
        <x-axis-item min="new DateTime(2005,1,1)" max="new DateTime(2006,1,1)">
        </x-axis-item>
    </x-axis>
    .XAxis(xAxis => xAxis
        .Min(new DateTime(2005,1,1))
        .Max(new DateTime(2005,1,2))
        // baseUnit is set to "days"
    )
    <x-axis>
        <x-axis-item min="new DateTime(2005,1,1)" max="new DateTime(2005,1,2)">
        </x-axis-item>
    </x-axis>
Manual Configuration
You can also manually specify the base unit by using the following valid options:
- Milliseconds
- Seconds
- Minutes
- Hours
- Days
- Weeks
- Months
- Years
Labels Format
The date axis provides options for specifying one format per base unit. If specified, the labels.format property takes priority. The global culture is used for formatting the dates and can be overridden by setting the labels.culture property.
    .XAxis(xAxis => xAxis
        .Labels(labels => labels
            .DateFormats(formats => formats.Days("M/d"))
        )
    )
    <x-axis>
        <x-axis-item>
            <labels>
                <chart-x-axis-labels-date-formats days="M/d"/>
            </labels>
        </x-axis-item>
    </x-axis>