Pyramid Charts
The Telerik UI Pyramid TagHelper and HtmlHelper for ASP.NET Core are server-side wrappers for the Kendo UI Pyramid Chart widget.
Pyramid Charts display a single series of data in progressively increasing proportions, organized in segments, where each segment represents the value for the particular item from the series. The values of the items can also influence the height and the shape of the corresponding segments.
Pyramid Charts are suitable to represent stages in a priority process, population vizualization, singular datasets, etc.
Concepts
The basic conceptual option of a Telerik UI Pyramid Chart is:
-
dynamicHeight&mdah;Whenequalis set tofalse,dynamicHeightspecifies whether the different elements will have equal height, or specifies whether the height of each element has to be based on its value.
Getting Started
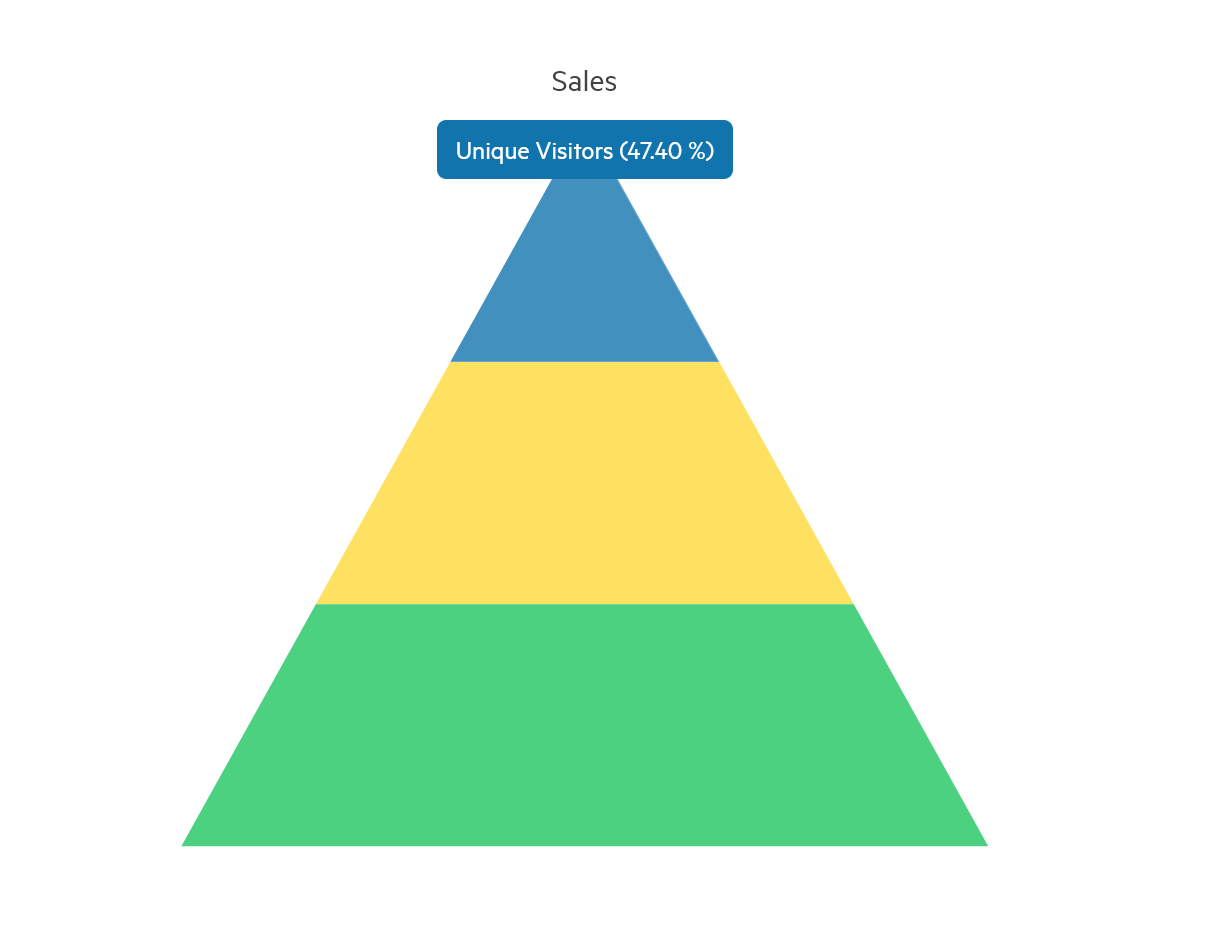
The following example demonstrates how to configure a basic Pyramid chart.
    @(Html.Kendo().Chart()
        .Name("chart")
        .Title(title => title
              .Text("Sales"))
        .Legend(legend => legend
            .Visible(false)
        )
        .Series(series => {
            series.Pyramid(new dynamic[] {
                new {category = "Unique Visitors", value = 280022},
                new {category = "Downloads", value = 190374},
                new {category = "Purchases", value = 120392},
            })
            .DynamicHeight(false)
            .Labels(labels => labels
                .Background("none")
            );
        })
        .Tooltip(tooltip => tooltip
            .Visible(true)
            .Template("#=category# (#=kendo.format('{0:p}', percentage)#)")
        )
    )
     <kendo-chart name="chart">
        <chart-title text="Sales"></chart-title>
        <chart-legend visible="false"></chart-legend>
        <series>
            <series-item dynamic-height="false" type="ChartSeriesType.Pyramid"
                   data='new dynamic[]{
                    new {
                        category= "Unique Visitors",
                        value= 280022
                    },
                    new {
                        category= "Downloads",
                        value= 190374
                    },
                    new {
                        category= "Purchases",
                        value= 120392
                    }
                }'>
                <labels background="none"></labels>
            </series-item>
        </series>
        <tooltip visible="true" template="#=category# (#=kendo.format('{0:p}', percentage)#)"></tooltip>
    </kendo-chart>