Gather Performance Data
The target machine to be monitored must have either Run Time edition or Test Studio installed on it. The Test Studio Execution Client needs to be running before Test Studio can connect to it for performance monitoring.
The below instruction assumes that you already have configured a performance run and you only need to add performance counters to be monitored.
-
Click the Configure button in the Set Up ribbon.

-
Click Continue to Step 2 > button in the Configure Performance Settings window.

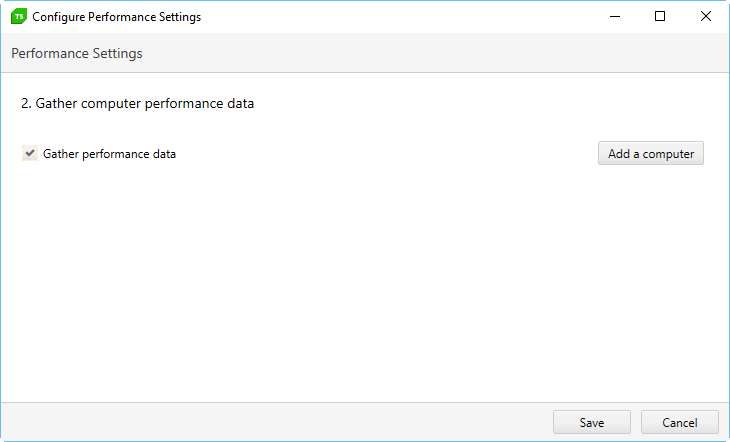
Check the Gather Computer Performance Data checkbox.
-
Click the Add a computer button.
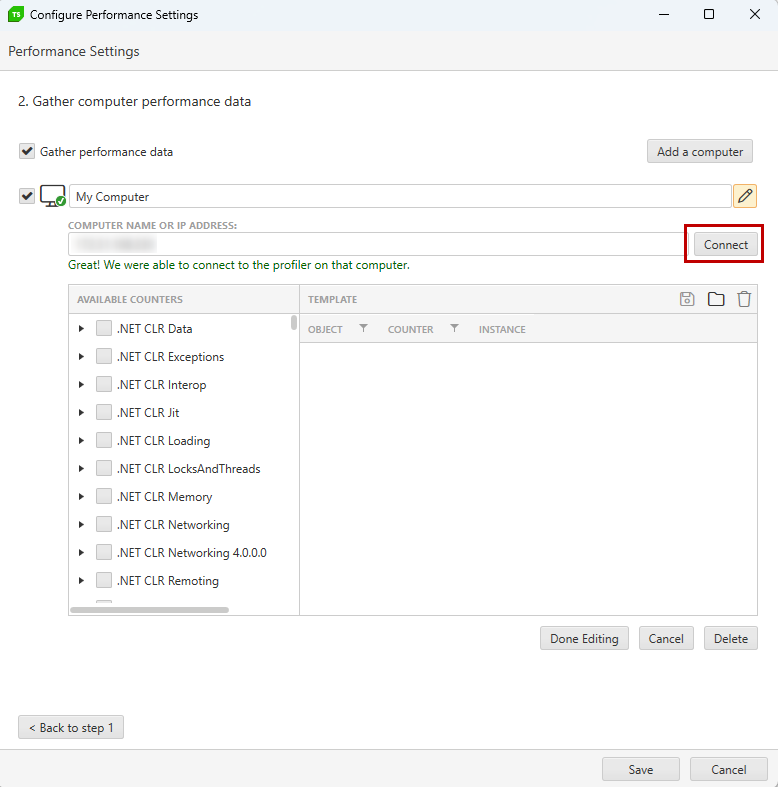
Set a friendly name for this machine configuration, then enter the actual machine name or IP address. The machine must be running the Test Studio Profiling Service, e.g. the Test Studio Execution client.
-
Click the Connect button to confirm a connection can be established.
Tip
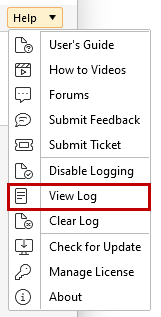
If the connection fails, go to the Help tab and click the View Log button in the Logging ribbon. The Enable button must be selected beforehand for the log to populate with information. If it is not useful for you, submit the generated log zipped into a support thread.
Note! The most common reason that the connection cannot be made is that the Profiler Service is not running on the computer you entered. That computer must have Run-Time Edition installed and the Test Studio Execution Client running. -
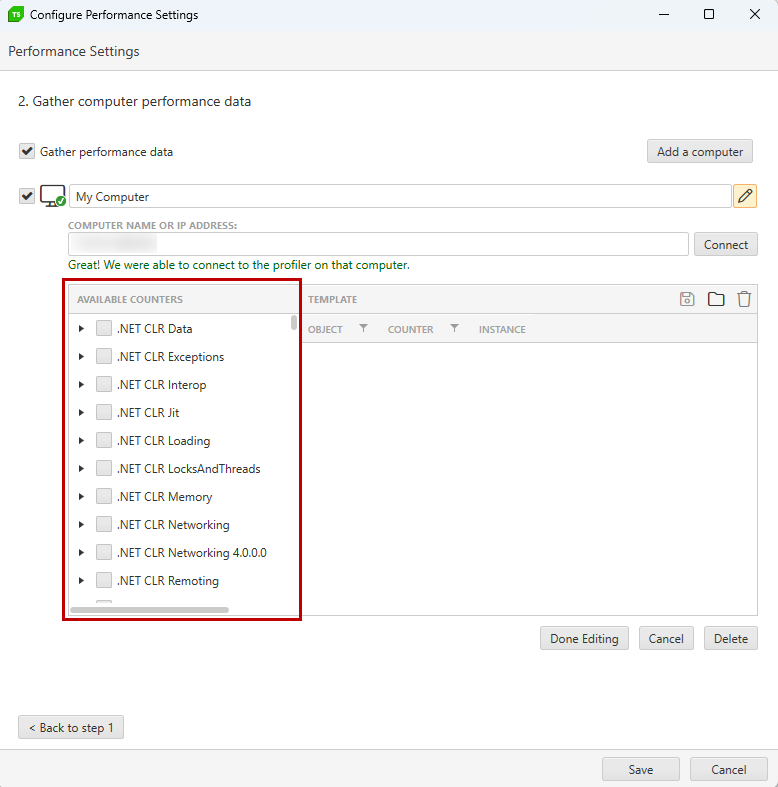
In the section labeled Select the system resources that you want to monitor choose from the list with Available Counters. Select an entire group, or expand the group to select specific counters within it.
Note!
It is up to you and your team to decide which Performance Counters to use for your application depending on the monitoring you need.
-
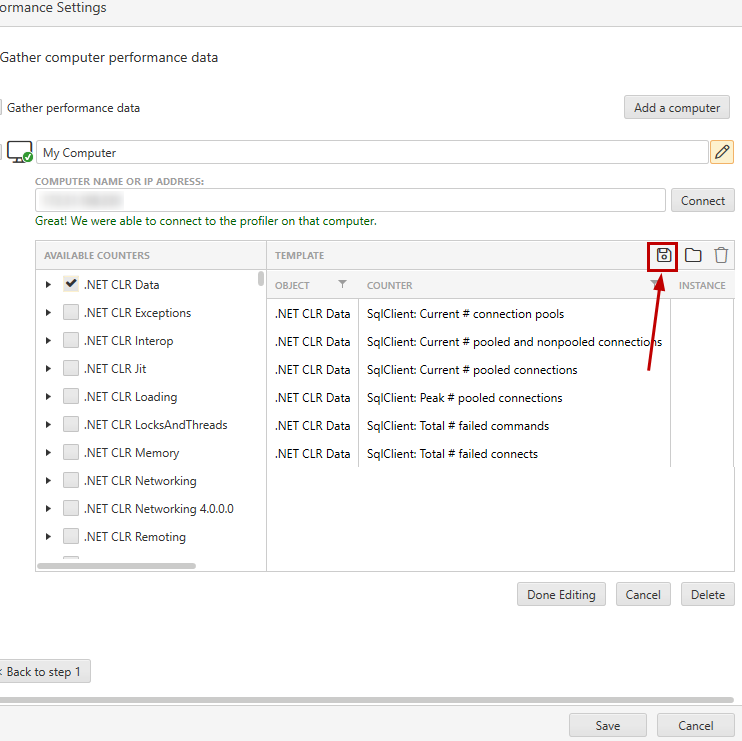
You can save this set of performance counters as a template, click
 .
.
Click Done Editing when finished. Click Cancel to revert changes. Click Delete to remove this server configuration.
-
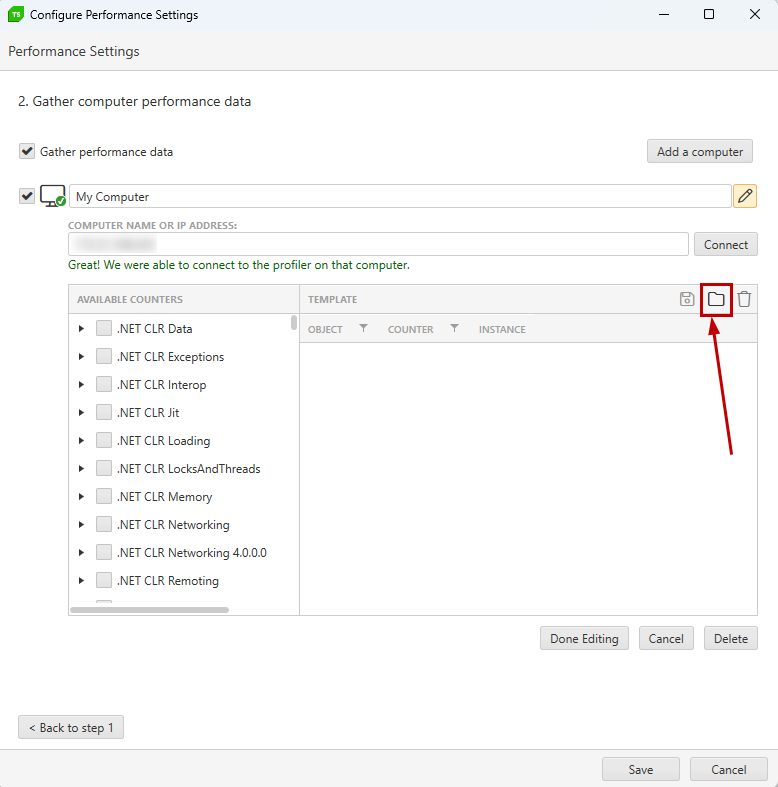
To import a previously saved template of performance counters, click
 .
.
Select the template you wish to use. You can view the performance counters included in this template. Click Add to use this template.
![Add Template][11]
-
You can monitor Performance Counters on more than one machine. Click the Add a computer button to gather performance data on another machine.

When finished click Save and continue to initiating the performance test run.