Grid Line
Grid line annotations are lines or circles that cross the chart grid at location on the axis, specified by their Value property.
Common properties to the three types of annotations include:
BorderDashStyle: Defines the dash style of the border of the annotation
BorderColor: Sets the color of the border of the annotation
BorderWidth: Specifies the width of the border of the annot
Cartesian Grid Line Annotation
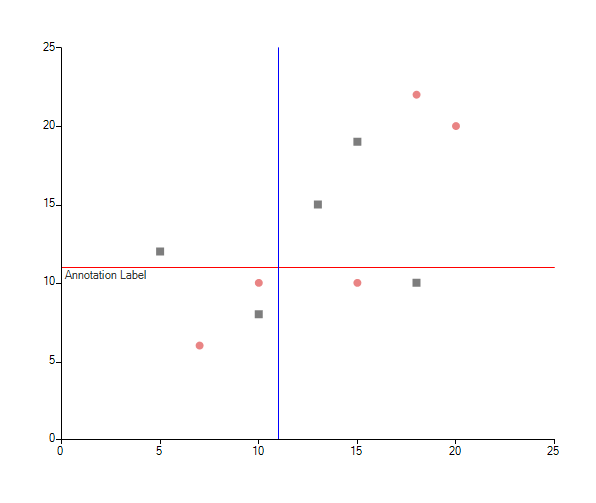
In the case of the Cartesian chart, the grid line represents a vertical or horizontal line that crosses the entire plot area.
Here is what CartesianGridLineAnnotation looks like:
Figure 1: CartesianGridLineAnnotation
Cartesian Grid Line Setup
CartesianGridLineAnnotation annotation1 = new CartesianGridLineAnnotation();
annotation1.Axis = this.radChartView1.Axes[1] as CartesianAxis;
annotation1.Value = 5.8;
annotation1.BorderColor = Color.Red;
annotation1.BorderDashStyle = DashStyle.Solid;
annotation1.BorderWidth = 1;
this.radChartView1.Annotations.Add(annotation1);
CartesianGridLineAnnotation annotation2 = new CartesianGridLineAnnotation();
annotation2.Axis = this.radChartView1.Axes[0] as CartesianAxis;
annotation2.Value = 2.9;
annotation2.BorderColor = Color.Blue;
annotation2.BorderDashStyle = DashStyle.Solid;
annotation2.BorderWidth = 1;
this.radChartView1.Annotations.Add(annotation2);
Dim annotation1 As New CartesianGridLineAnnotation()
annotation1.Axis = TryCast(Me.radChartView1.Axes(1), CartesianAxis)
annotation1.Value = 5.8
annotation1.BorderColor = Color.Red
annotation1.BorderDashStyle = DashStyle.Solid
annotation1.BorderWidth = 1
Me.radChartView1.Annotations.Add(annotation1)
Dim annotation2 As New CartesianGridLineAnnotation()
annotation2.Axis = TryCast(Me.radChartView1.Axes(0), CartesianAxis)
annotation2.Value = 2.9
annotation2.BorderColor = Color.Blue
annotation2.BorderDashStyle = DashStyle.Solid
annotation2.BorderWidth = 1
Me.radChartView1.Annotations.Add(annotation2)
Properties:
Axis: The Cartesian grid line annotation needs to be associated with horizontal or vertical axis explicitly
Value (of type object): The place on the associated axis where the annotation crosses it. When the associated axis is numerical (linear or logarithmic) a numeric value is expected and when it is a categorical - a category
Label: This property allows you to display text near the annotation and indicate what it is for.
Polar Axis Grid Line Annotation
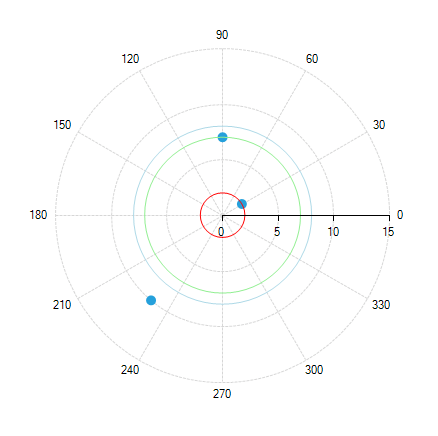
Polar axis grid lines represent concentric circles that cross the Polar axis at the corresponding Value.
Here is what PolarAxisGridLineAnnotation looks like:
Figure 2: PolarAxisGridLineAnnotation
Plar Grid Line Setup
PolarAxisGridLineAnnotation annotation1 = new PolarAxisGridLineAnnotation();
annotation1.Value = 2;
annotation1.BorderColor = Color.Red;
annotation1.BorderDashStyle = DashStyle.Solid;
annotation1.BorderWidth = 1;
this.radChartView1.Annotations.Add(annotation1);
PolarAxisGridLineAnnotation annotation2 = new PolarAxisGridLineAnnotation();
annotation2.Value = 7;
annotation2.BorderColor = Color.LightGreen;
annotation2.BorderDashStyle = DashStyle.Solid;
annotation2.BorderWidth = 1;
this.radChartView1.Annotations.Add(annotation2);
PolarAxisGridLineAnnotation annotation3 = new PolarAxisGridLineAnnotation();
annotation3.Value = 8;
annotation3.BorderColor = Color.LightBlue;
annotation3.BorderDashStyle = DashStyle.Solid;
annotation3.BorderWidth = 1;
this.radChartView1.Annotations.Add(annotation3);
Dim annotation1 As New PolarAxisGridLineAnnotation()
annotation1.Value = 2
annotation1.BorderColor = Color.Red
annotation1.BorderDashStyle = DashStyle.Solid
annotation1.BorderWidth = 1
Me.radChartView1.Annotations.Add(annotation1)
Dim annotation2 As New PolarAxisGridLineAnnotation()
annotation2.Value = 7
annotation2.BorderColor = Color.LightGreen
annotation2.BorderDashStyle = DashStyle.Solid
annotation2.BorderWidth = 1
Me.radChartView1.Annotations.Add(annotation2)
Dim annotation3 As New PolarAxisGridLineAnnotation()
annotation3.Value = 8
annotation3.BorderColor = Color.LightBlue
annotation3.BorderDashStyle = DashStyle.Solid
annotation3.BorderWidth = 1
Me.radChartView1.Annotations.Add(annotation3)
Property:
- Value (of type double): Specifies the location on the Polar axis (the radius), where the grid line will cross
Radial Axis Grid Line Annotation
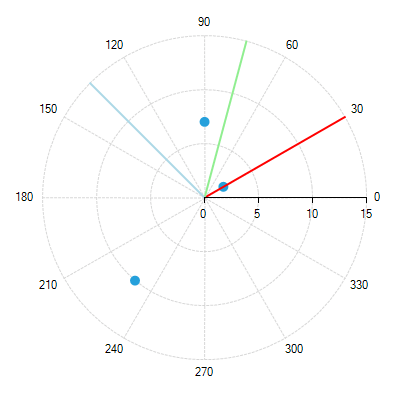
Radial axis grid lines basically represent the radius of the polar chart.
Here is what RadialAxisGridLineAnnotation looks like:
capion Figure 3: RadialAxisGridLineAnnotation
RadialAxisGridLineAnnotation annotation1 = new RadialAxisGridLineAnnotation();
annotation1.Value = 30;
annotation1.BorderColor = Color.Red;
annotation1.BorderDashStyle = DashStyle.Solid;
annotation1.BorderWidth = 2;
this.radChartView1.Annotations.Add(annotation1);
RadialAxisGridLineAnnotation annotation2 = new RadialAxisGridLineAnnotation();
annotation2.Value = 75;
annotation2.BorderColor = Color.LightGreen;
annotation2.BorderDashStyle = DashStyle.Solid;
annotation2.BorderWidth = 2;
this.radChartView1.Annotations.Add(annotation2);
RadialAxisGridLineAnnotation annotation3 = new RadialAxisGridLineAnnotation();
annotation3.Value = 135;
annotation3.BorderColor = Color.LightBlue;
annotation3.BorderDashStyle = DashStyle.Solid;
annotation3.BorderWidth = 2;
this.radChartView1.Annotations.Add(annotation3);
Dim annotation1 As New RadialAxisGridLineAnnotation()
annotation1.Value = 30
annotation1.BorderColor = Color.Red
annotation1.BorderDashStyle = DashStyle.Solid
annotation1.BorderWidth = 2
Me.radChartView1.Annotations.Add(annotation1)
Dim annotation2 As New RadialAxisGridLineAnnotation()
annotation2.Value = 75
annotation2.BorderColor = Color.LightGreen
annotation2.BorderDashStyle = DashStyle.Solid
annotation2.BorderWidth = 2
Me.radChartView1.Annotations.Add(annotation2)
Dim annotation3 As New RadialAxisGridLineAnnotation()
annotation3.Value = 135
annotation3.BorderColor = Color.LightBlue
annotation3.BorderDashStyle = DashStyle.Solid
annotation3.BorderWidth = 2
Me.radChartView1.Annotations.Add(annotation3)
Property:
- Value (of type object): Specifies the location on the Radial axis, where the grid line will cross. When the Radial axis is NumericRadialAxis a numeric value is expected and when it is a CategoricalRadialAxis - a category