Inverse Axis
The IsInverse property of the abstract LineAxis class determines whether an axis of a RadChartView will be reversed. In certain areas in engineering or physics it is a standard for some data representation an axis to be inverse.
Vertical Axis Inversion
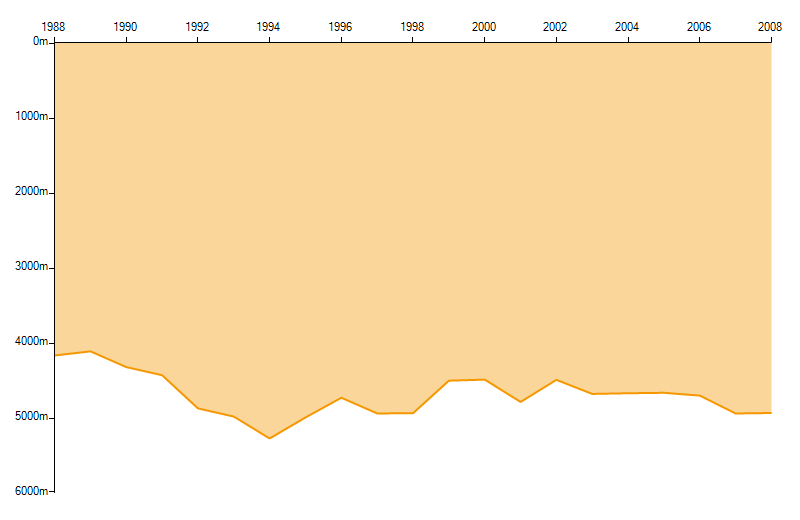
This example will demosntrate the depths of crude oil wells in the period between 1988 and 2008.
Axis Inversion
DataTable tableDryHoles = new DataTable("CrudeOil");
tableDryHoles.Columns.Add("Time", typeof(DateTime));
tableDryHoles.Columns.Add("Depth", typeof(double));
Color dryHoleColor = Color.FromArgb(245, 151, 0);
Dictionary<DateTime, double> data = new Dictionary<DateTime, double>();
data[new DateTime(1988, 06, 30)] = 4171.0;
data[new DateTime(1989, 06, 30)] = 4116.0;
data[new DateTime(1990, 06, 30)] = 4326.0;
data[new DateTime(1991, 06, 30)] = 4434.0;
data[new DateTime(1992, 06, 30)] = 4877.0;
data[new DateTime(1993, 06, 30)] = 4986.0;
data[new DateTime(1994, 06, 30)] = 5278.0;
data[new DateTime(1995, 06, 30)] = 4998.0;
data[new DateTime(1996, 06, 30)] = 4735.0;
data[new DateTime(1997, 06, 30)] = 4944.0;
data[new DateTime(1998, 06, 30)] = 4941.0;
data[new DateTime(1999, 06, 30)] = 4507.0;
data[new DateTime(2000, 06, 30)] = 4493.0;
data[new DateTime(2001, 06, 30)] = 4791.0;
data[new DateTime(2002, 06, 30)] = 4496.0;
data[new DateTime(2003, 06, 30)] = 4684.0;
data[new DateTime(2004, 06, 30)] = 4675.0;
data[new DateTime(2005, 06, 30)] = 4669.0;
data[new DateTime(2006, 06, 30)] = 4706.0;
data[new DateTime(2007, 06, 30)] = 4945.0;
data[new DateTime(2008, 06, 30)] = 4938.0;
foreach (KeyValuePair<DateTime, double> hole in data)
{
    tableDryHoles.Rows.Add(hole.Key, hole.Value);
}
LinearAxis verticalAxis = new LinearAxis();
verticalAxis.AxisType = AxisType.Second;
verticalAxis.LabelFormat = "{0}m";
verticalAxis.IsInverse = true;
DateTimeContinuousAxis horizontalAxis = new DateTimeContinuousAxis();
horizontalAxis.LabelFormat = "{0:yyyy}";
horizontalAxis.VerticalLocation = AxisVerticalLocation.Top;
horizontalAxis.MajorStep = 2;
horizontalAxis.MajorStepUnit = Telerik.Charting.TimeInterval.Year;
AreaSeries dryHoles = new AreaSeries();
dryHoles.BackColor = Color.FromArgb(100, dryHoleColor);
dryHoles.BorderColor = dryHoleColor;
dryHoles.DataMember = "CrudeOil";
dryHoles.ValueMember = "Depth";
dryHoles.CategoryMember = "Time";
dryHoles.VerticalAxis = verticalAxis;
dryHoles.HorizontalAxis = horizontalAxis;
this.radChartView1.DataSource = tableDryHoles;
this.radChartView1.Series.Add(dryHoles);
Dim tableDryHoles As New DataTable("CrudeOil")
tableDryHoles.Columns.Add("Time", GetType(DateTime))
tableDryHoles.Columns.Add("Depth", GetType(Double))
Dim dryHoleColor As Color = Color.FromArgb(245, 151, 0)
Dim data As New Dictionary(Of DateTime, Double)()
data(New DateTime(1988, 6, 30)) = 4171.0
data(New DateTime(1989, 6, 30)) = 4116.0
data(New DateTime(1990, 6, 30)) = 4326.0
data(New DateTime(1991, 6, 30)) = 4434.0
data(New DateTime(1992, 6, 30)) = 4877.0
data(New DateTime(1993, 6, 30)) = 4986.0
data(New DateTime(1994, 6, 30)) = 5278.0
data(New DateTime(1995, 6, 30)) = 4998.0
data(New DateTime(1996, 6, 30)) = 4735.0
data(New DateTime(1997, 6, 30)) = 4944.0
data(New DateTime(1998, 6, 30)) = 4941.0
data(New DateTime(1999, 6, 30)) = 4507.0
data(New DateTime(2000, 6, 30)) = 4493.0
data(New DateTime(2001, 6, 30)) = 4791.0
data(New DateTime(2002, 6, 30)) = 4496.0
data(New DateTime(2003, 6, 30)) = 4684.0
data(New DateTime(2004, 6, 30)) = 4675.0
data(New DateTime(2005, 6, 30)) = 4669.0
data(New DateTime(2006, 6, 30)) = 4706.0
data(New DateTime(2007, 6, 30)) = 4945.0
data(New DateTime(2008, 6, 30)) = 4938.0
For Each hole As KeyValuePair(Of DateTime, Double) In data
    tableDryHoles.Rows.Add(hole.Key, hole.Value)
Next
Dim verticalAxis As New LinearAxis()
verticalAxis.AxisType = AxisType.Second
verticalAxis.LabelFormat = "{0}m"
verticalAxis.IsInverse = True
Dim horizontalAxis As New DateTimeContinuousAxis()
horizontalAxis.LabelFormat = "{0:yyyy}"
horizontalAxis.VerticalLocation = AxisVerticalLocation.Top
horizontalAxis.MajorStep = 2
horizontalAxis.MajorStepUnit = Telerik.Charting.TimeInterval.Year
Dim dryHoles As New AreaSeries()
dryHoles.BackColor = Color.FromArgb(100, dryHoleColor)
dryHoles.BorderColor = dryHoleColor
dryHoles.DataMember = "CrudeOil"
dryHoles.ValueMember = "Depth"
dryHoles.CategoryMember = "Time"
dryHoles.VerticalAxis = verticalAxis
dryHoles.HorizontalAxis = horizontalAxis
Me.RadChartView1.DataSource = tableDryHoles
Me.RadChartView1.Series.Add(dryHoles)
Figure 1: Inverse Axis