100% Stacked Series
The 100% stacked series display the values from multiple series as stacks or group of stacks over the x-axis categories, where the values proportions from each stack totals 100%. This series type is useful for cases where the contribution of values within stacks is more meaningful than the amounts themselves.
The functionality is available for category series - bar, column, line, area and radar (area, line and column).
Configure 100% Stacked Series
To configure 100% stacked series you should set the following properties of the first series - Stacked="true" and StackType="Stack100".
Figure 1: Shows the output from Example 1, which demonstrates stacked 100% column series.
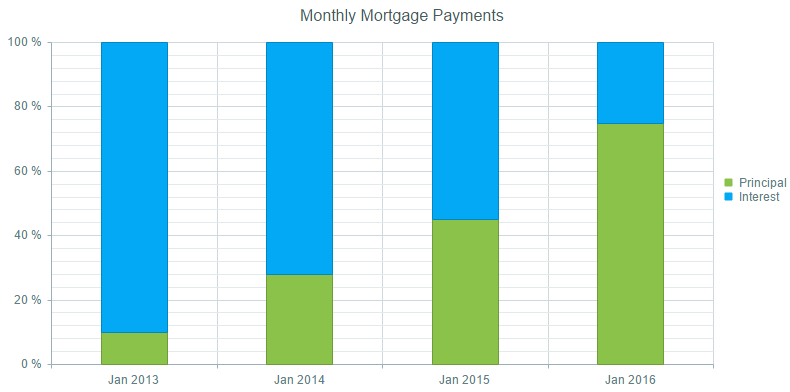
You can create Figure 1 using the markup in Example 1.
Example 1: Shows an implementation of chart with 100% stacked columns.
<telerik:RadHtmlChart runat="server" ID="RadHtmlChart1" Height="400px" Width="800px" Skin="Material">
    <PlotArea>
        <Series>
            <telerik:ColumnSeries Name="Principal" Stacked="true" StackType="Stack100">
                <SeriesItems>
                    <telerik:CategorySeriesItem Y="100" />
                    <telerik:CategorySeriesItem Y="280" />
                    <telerik:CategorySeriesItem Y="450" />
                    <telerik:CategorySeriesItem Y="750" />
                </SeriesItems>
                <LabelsAppearance Visible="false"></LabelsAppearance>
            </telerik:ColumnSeries>
            <telerik:ColumnSeries Name="Interest">
                <SeriesItems>
                    <telerik:CategorySeriesItem Y="900" />
                    <telerik:CategorySeriesItem Y="720" />
                    <telerik:CategorySeriesItem Y="550" />
                    <telerik:CategorySeriesItem Y="250" />
                </SeriesItems>
                <LabelsAppearance Visible="false"></LabelsAppearance>
            </telerik:ColumnSeries>
        </Series>
        <XAxis>
            <Items>
                <telerik:AxisItem LabelText="Jan 2013" />
                <telerik:AxisItem LabelText="Jan 2014" />
                <telerik:AxisItem LabelText="Jan 2015" />
                <telerik:AxisItem LabelText="Jan 2016" />
            </Items>
        </XAxis>
    </PlotArea>
    <ChartTitle Text="Monthly Mortgage Payments"></ChartTitle>
</telerik:RadHtmlChart>
Configure 100% Stacked and Grouped Series
To configure 100% stacked and grouped series, you should do the following:
Set the the following property to the first series -
StackType="Stack100".Set the same group name to the
GroupNameproperty of series that will be stacked in a separate group.
If you leave the
GroupNameproperty blank, all the series will be placed in one default stack. Setting theGroupNameproperty of any series automatically sets theStackedproperty of the first series totrue, so it is not required to be explicitly set.
Figure 2: Shows the outpue from Example 2, which demonstrates a 100% stacked and grouped column series.
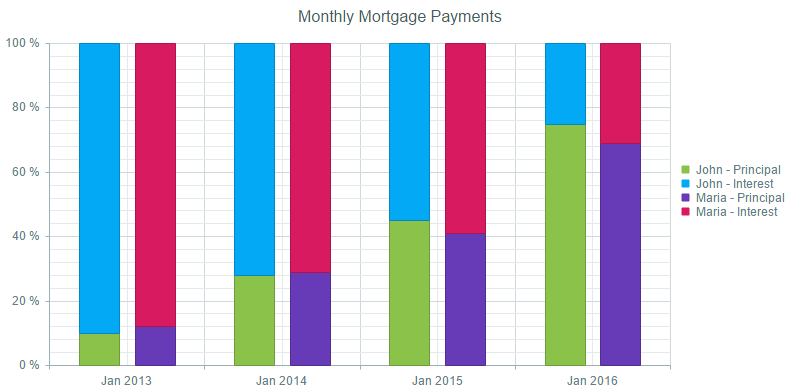
You can create Figure 2 using the markup in Example 2.
Example 2: Shows an implementation of chart with 100% stacked and grouped columns.
<telerik:RadHtmlChart runat="server" ID="RadHtmlChart1" Height="400px" Width="800px" Skin="Material">
    <PlotArea>
        <Series>
            <telerik:ColumnSeries Name="Principal" StackType="Stack100" GroupName="John">
                <SeriesItems>
                    <telerik:CategorySeriesItem Y="100" />
                    <telerik:CategorySeriesItem Y="280" />
                    <telerik:CategorySeriesItem Y="450" />
                    <telerik:CategorySeriesItem Y="750" />
                </SeriesItems>
                <LabelsAppearance Visible="false"></LabelsAppearance>
            </telerik:ColumnSeries>
            <telerik:ColumnSeries Name="Interest" GroupName="John">
                <SeriesItems>
                    <telerik:CategorySeriesItem Y="900" />
                    <telerik:CategorySeriesItem Y="720" />
                    <telerik:CategorySeriesItem Y="550" />
                    <telerik:CategorySeriesItem Y="250" />
                </SeriesItems>
                <LabelsAppearance Visible="false"></LabelsAppearance>
            </telerik:ColumnSeries>
            <telerik:ColumnSeries Name="Principal" GroupName="Maria">
                <SeriesItems>
                    <telerik:CategorySeriesItem Y="120" />
                    <telerik:CategorySeriesItem Y="290" />
                    <telerik:CategorySeriesItem Y="410" />
                    <telerik:CategorySeriesItem Y="690" />
                </SeriesItems>
                <LabelsAppearance Visible="false"></LabelsAppearance>
            </telerik:ColumnSeries>
            <telerik:ColumnSeries Name="Interest" GroupName="Maria">
                <SeriesItems>
                    <telerik:CategorySeriesItem Y="880" />
                    <telerik:CategorySeriesItem Y="710" />
                    <telerik:CategorySeriesItem Y="590" />
                    <telerik:CategorySeriesItem Y="310" />
                </SeriesItems>
                <LabelsAppearance Visible="false"></LabelsAppearance>
            </telerik:ColumnSeries>
        </Series>
        <XAxis>
            <Items>
                <telerik:AxisItem LabelText="Jan 2013" />
                <telerik:AxisItem LabelText="Jan 2014" />
                <telerik:AxisItem LabelText="Jan 2015" />
                <telerik:AxisItem LabelText="Jan 2016" />
            </Items>
        </XAxis>
    </PlotArea>
    <ClientEvents OnLoad="setLegend" />
    <ChartTitle Text="Monthly Mortgage Payments"></ChartTitle>
</telerik:RadHtmlChart>
<script>
    function setLegend(sender, args) {
        var kendoWidget = sender.get_kendoWidget();
        kendoWidget.options.legend.labels.template = "#=series.stack.group# - #=text#";
        kendoWidget.redraw();
    }
</script>