OhlcSeries
Overview
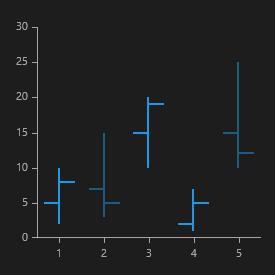
The OhlcSeries are usually used to represent financial data. The data points representation consists of:
- Vertical line - shows the price range (the highest and lowest prices) over one unit of time
-
Tick marks - on each side of the line:
- Left - Indicate the opening price for the time period.
- Right - Indicate the closing price for the time period.
- Color hue - Different color hues could be used to indicate whether prices rose or fell in that period.
This is how the OhlcSeries are represented by the RadCartesianChart.
OhlcSeries class inherits from the OhlcSeriesBase class - See the inherited properties.
Example
Here's an example of how to create a RadCartesianChart with OhlcSeries.
-
First, create a class for the sample data.
public class FinancialData { public double High { get; set; } public double Low { get; set; } public double Open { get; set; } public double Close { get; set; } } -
Then create the sample data.
List<FinancialData> sampleData = new List<FinancialData>(); sampleData.Add(new FinancialData() { High = 10, Open = 5, Low = 2, Close = 8 }); sampleData.Add(new FinancialData() { High = 15, Open = 7, Low = 3, Close = 5 }); sampleData.Add(new FinancialData() { High = 20, Open = 15, Low = 10, Close = 19 }); sampleData.Add(new FinancialData() { High = 7, Open = 2, Low = 1, Close = 5 }); sampleData.Add(new FinancialData() { High = 25, Open = 15, Low = 10, Close = 12 }); this.ohlcSeries.DataContext = sampleData; -
Finally, create the chart using XAML.
<telerikChart:RadCartesianChart x:Name="ohlcSeries">
    <telerikChart:RadCartesianChart.VerticalAxis>
        <telerikChart:LinearAxis/>
    </telerikChart:RadCartesianChart.VerticalAxis>
    <telerikChart:RadCartesianChart.HorizontalAxis>
        <telerikChart:CategoricalAxis/>
    </telerikChart:RadCartesianChart.HorizontalAxis>

    <telerikChart:OhlcSeries ItemsSource="{Binding}">
        <telerikChart:OhlcSeries.HighBinding>
            <telerikChart:PropertyNameDataPointBinding PropertyName="High"/>
        </telerikChart:OhlcSeries.HighBinding>
        <telerikChart:OhlcSeries.LowBinding>
            <telerikChart:PropertyNameDataPointBinding PropertyName="Low"/>
        </telerikChart:OhlcSeries.LowBinding>
        <telerikChart:OhlcSeries.OpenBinding>
            <telerikChart:PropertyNameDataPointBinding PropertyName="Open"/>
        </telerikChart:OhlcSeries.OpenBinding>
        <telerikChart:OhlcSeries.CloseBinding>
            <telerikChart:PropertyNameDataPointBinding PropertyName="Close"/>
        </telerikChart:OhlcSeries.CloseBinding>
    </telerikChart:OhlcSeries>
</telerikChart:RadCartesianChart>