Reports
With the expanded reporting functionality, spotting test pass/failure trends and identifying weak spots in tested applications is swift and effortless. From the Reports tab, you have the ability to:
To explore test list results over time.
Experience enhanced visualization of test results through interactive graphs and charts.
Export reports as a PNG image or HTML file.
Leave comments within reports.
2016 R3 Version and Earlier
Select a test list from the first drop-down menu, specify a date range, and enable or disable the pass/fail lines. A bar graph is populated with Run Results on the X-axis by date/time and number of Tests in List on the Y-axis.
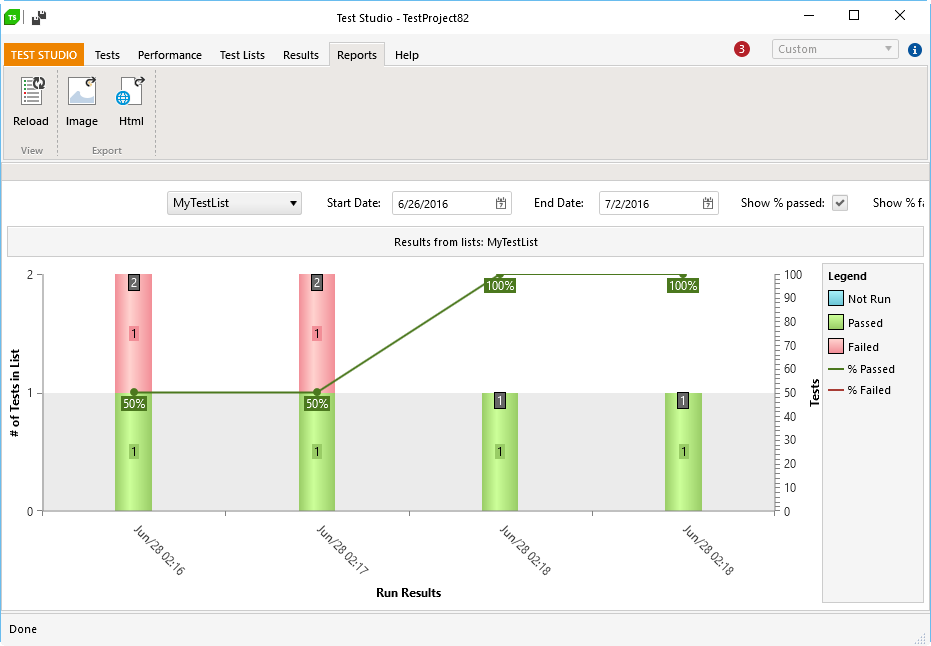
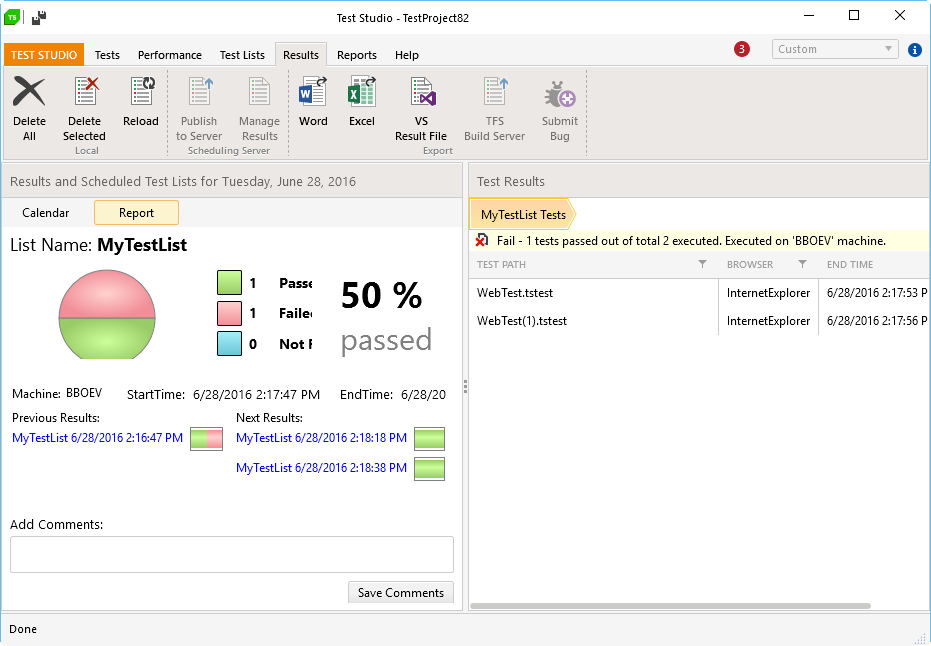
You can generate more meaningful graphs that support drill-downs, as well as having single test list results displayed in easy-to-read pie charts.
To do so, click on the bar for which you want more information, and you are taken to the Results tab.
Switch between the pie chart report and the calendar view.
View previous and next results for the selected test list.
Add comments.
Drill down further into each test and its steps in the Test Results pane.