Getting Started
This tutorial will guide you through your first steps of creating a report from scratch using the Web Report Designer. By the end of this tutorial, you will have created a basic report with a table that displays data from a web service.
What You'll Build
In this tutorial, you'll create a simple report that:
- Connects to a Telerik demo web service
- Displays data in a formatted table
- Can be previewed and exported
Before You Start
Make sure you have access to:
- Your company's instance of the Telerik Web Report Designer.
- A data source to feed the report with data. For this tutorial, you can use a data source provided by Telerik. However, you can use virtually any data source, for example, a web service, SQL, CSV, GraphQL, and more.
Creating the Report and Connecting It to Data
-
Create a new empty report by clicking New Report in the main menu:
-
On the Components tab, go to Data Sources and select Web Service Data Source:
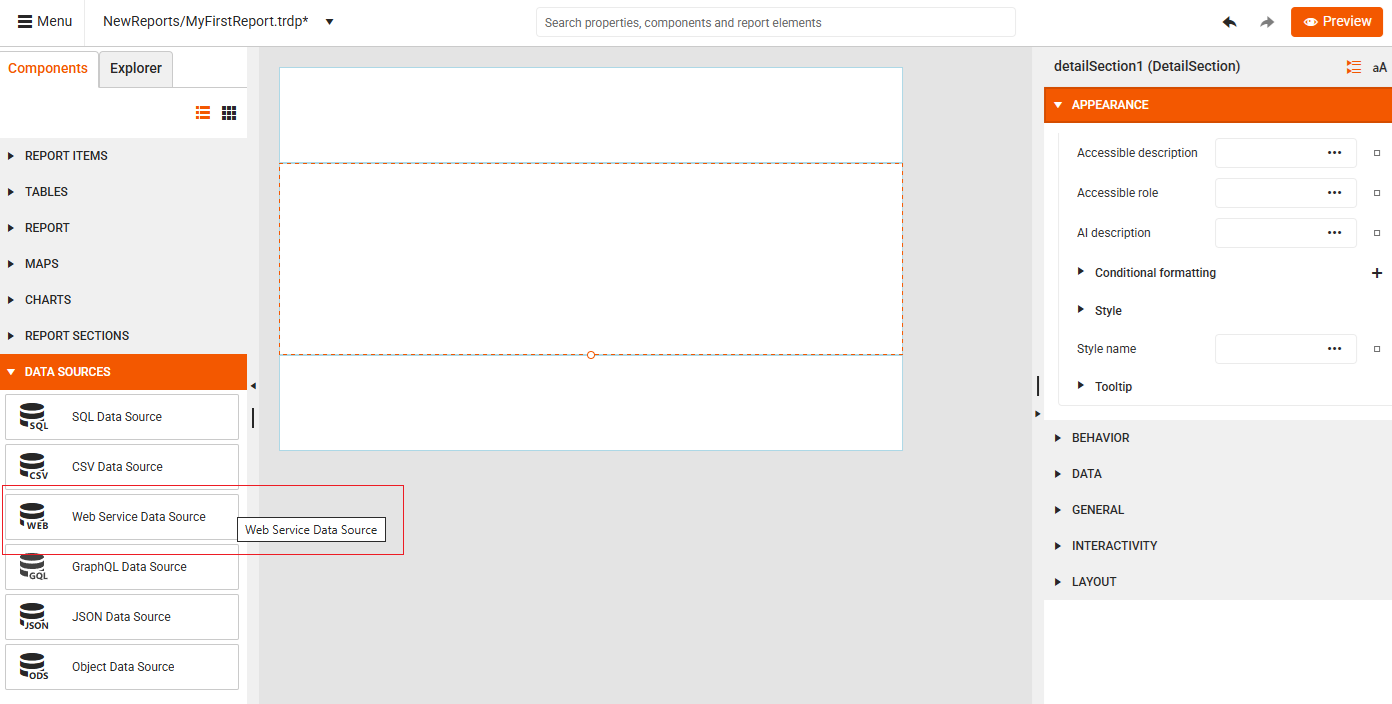
Alternatively, you can type "Web Service Data Source" in the Search box to let the designer locate the tool for you.
-
On the Configure Data Retrieval screen, enter the URL of the web service providing the data for your report and then click Finish.
https://demos.telerik.com/reporting/api/data/productsales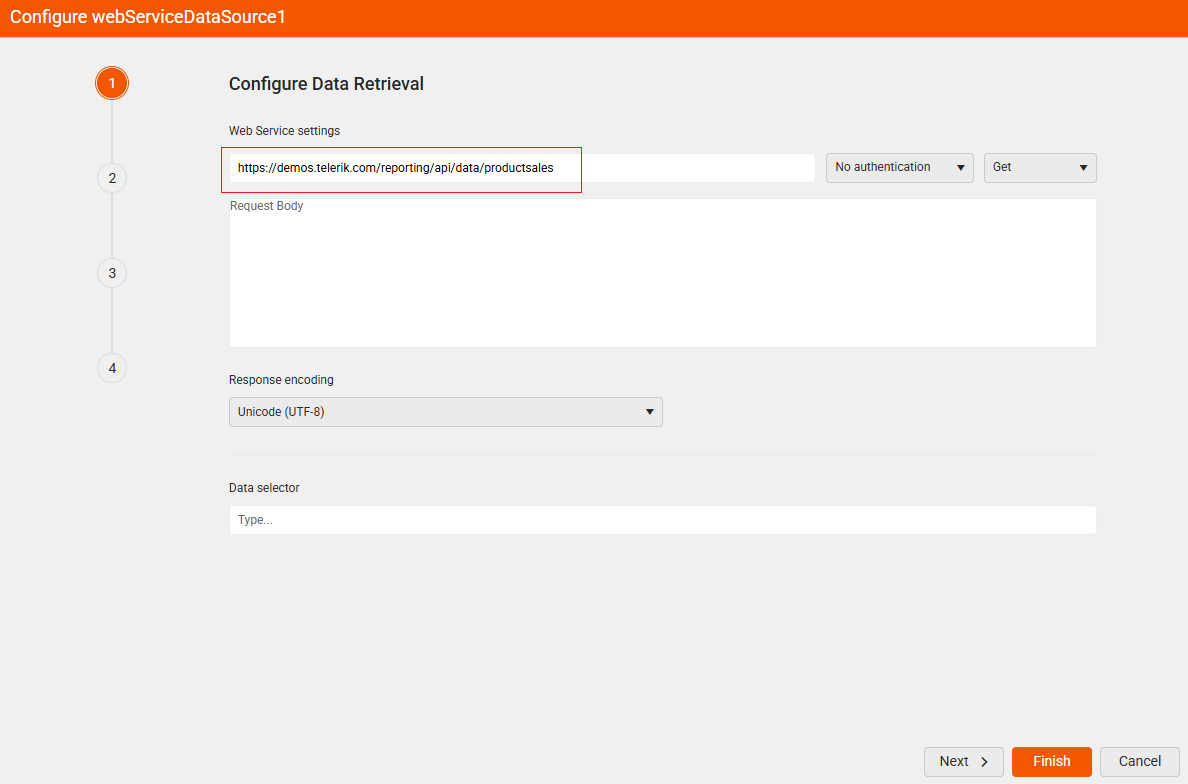
Now you have a blank report that is connected to data.
Adding Items to Your Report
Next, design the report by adding a Table report item to display your data.
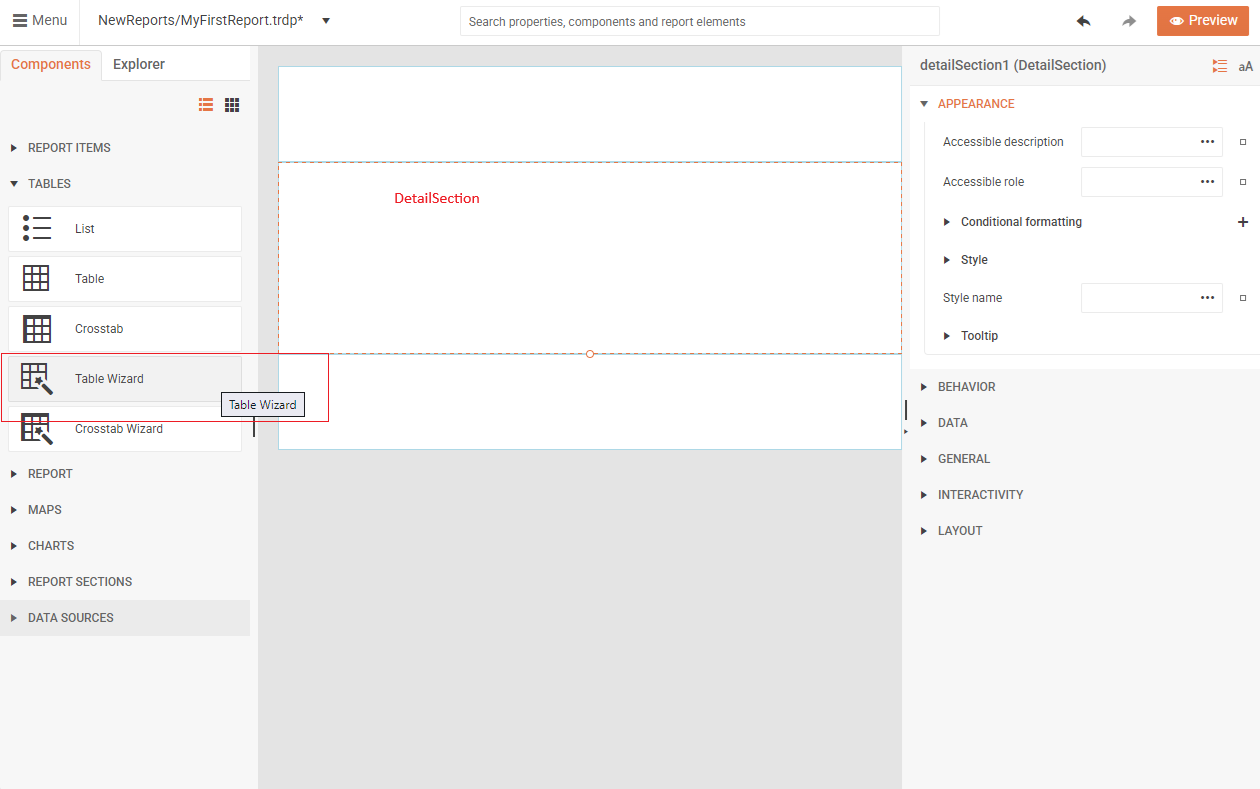
Click the report's Detail Section to select it as a target container for adding report items. The default selection is the report itself, which doesn't allow adding tables directly, causing the Table item and Table Wizard to be grayed out.
-
Select the Components tab, and then click the Table Wizard button:
-
Configure the Table as illustrated in the animation below. Select the data fields you want to display and arrange them in the table columns:
-
(Optional) Style the Table using the APPEARANCE options in the Properties panel:
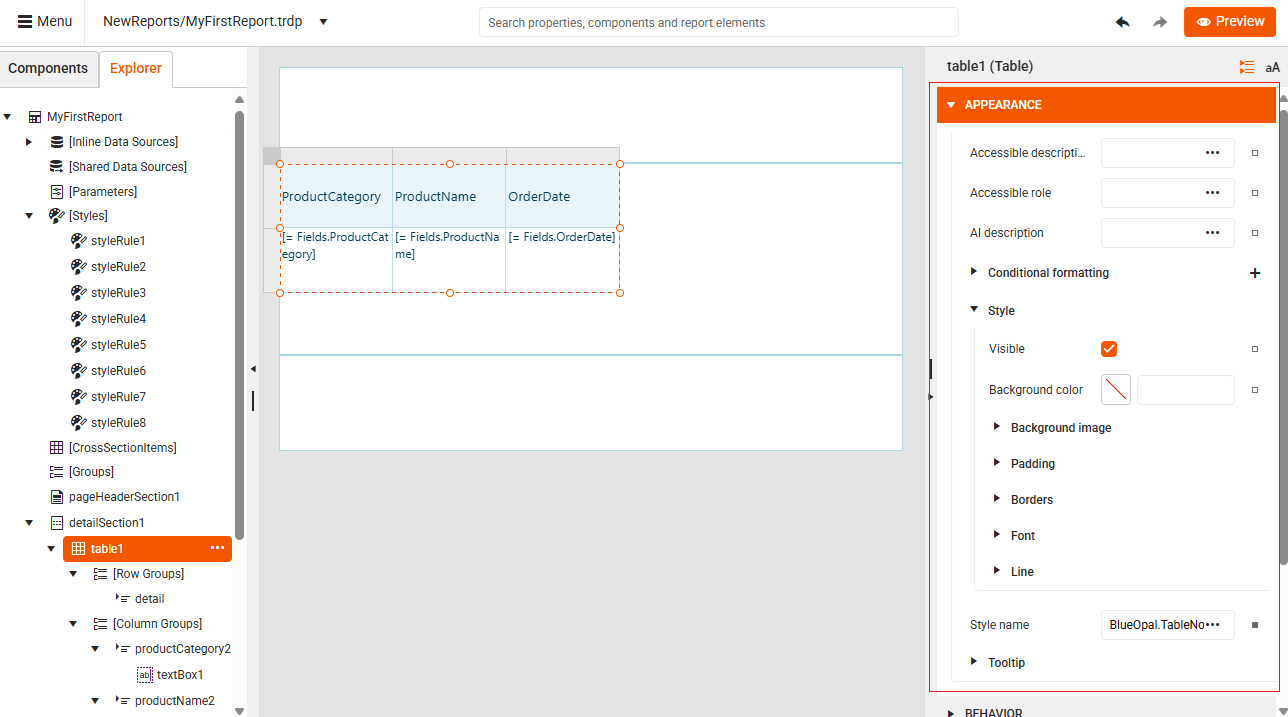
-
Click the Preview button in the top-right corner to see your completed report with a table populated with data from the web service:
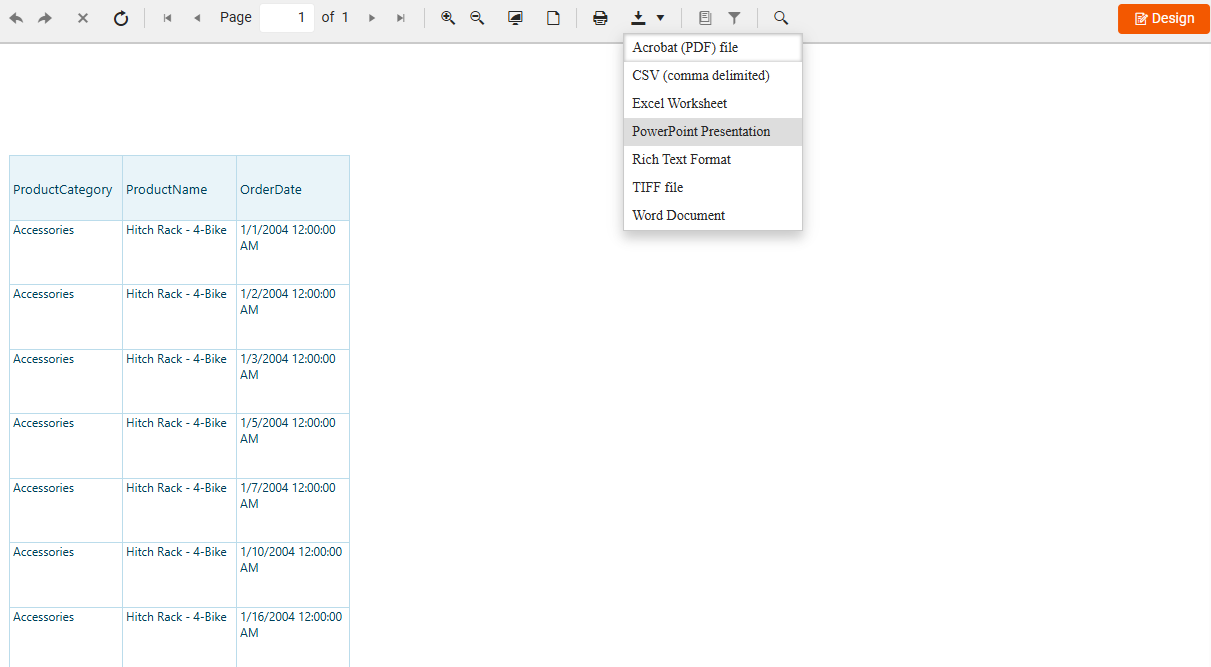
Congratulations! You have successfully created your first report with the Web Report Designer.
Next Steps
Now that you've created your first report, you can:
- Add more report items like charts, images, or text boxes
- Explore different data source types
- Learn about report sections to organize your content
- Apply advanced formatting and styling options
Video Tutorial
For a visual walkthrough, watch this video tutorial that demonstrates creating a report with a chart. The video covers the Visual Studio setup initially, but the Web Report Designer portion starts at the 3:08 mark: