Rendering Layered Backgrounds in Telerik Reporting
Environment
| Product | Reporting |
Description
I need to display overlapping date ranges inside a Crosstab/Table/List report item. Each row represents a unit, and each monthly cell should visually depict three date ranges with distinct background colors.
The ranges overlap, and their rendering should follow a layered approach, with the outermost range appearing behind the inner ones. I need guidance on calculating pixel positions dynamically and rendering layered backgrounds within each cell.
Solution
To achieve layered background rendering for overlapping date ranges:
- Use a Crosstab item to represent the data in a tabular format.
- Place a Panel inside the crosstab cells where you need to display the date ranges. The panel will occupy the entire cell and act as a container for other elements, such as TextBox items. This approach allows you to configure the textboxes as needed, since a single textbox alone would otherwise fill the entire cell.
- Add multiple TextBox items inside the panel to represent the date ranges. Each TextBox should correspond to a single date range color.
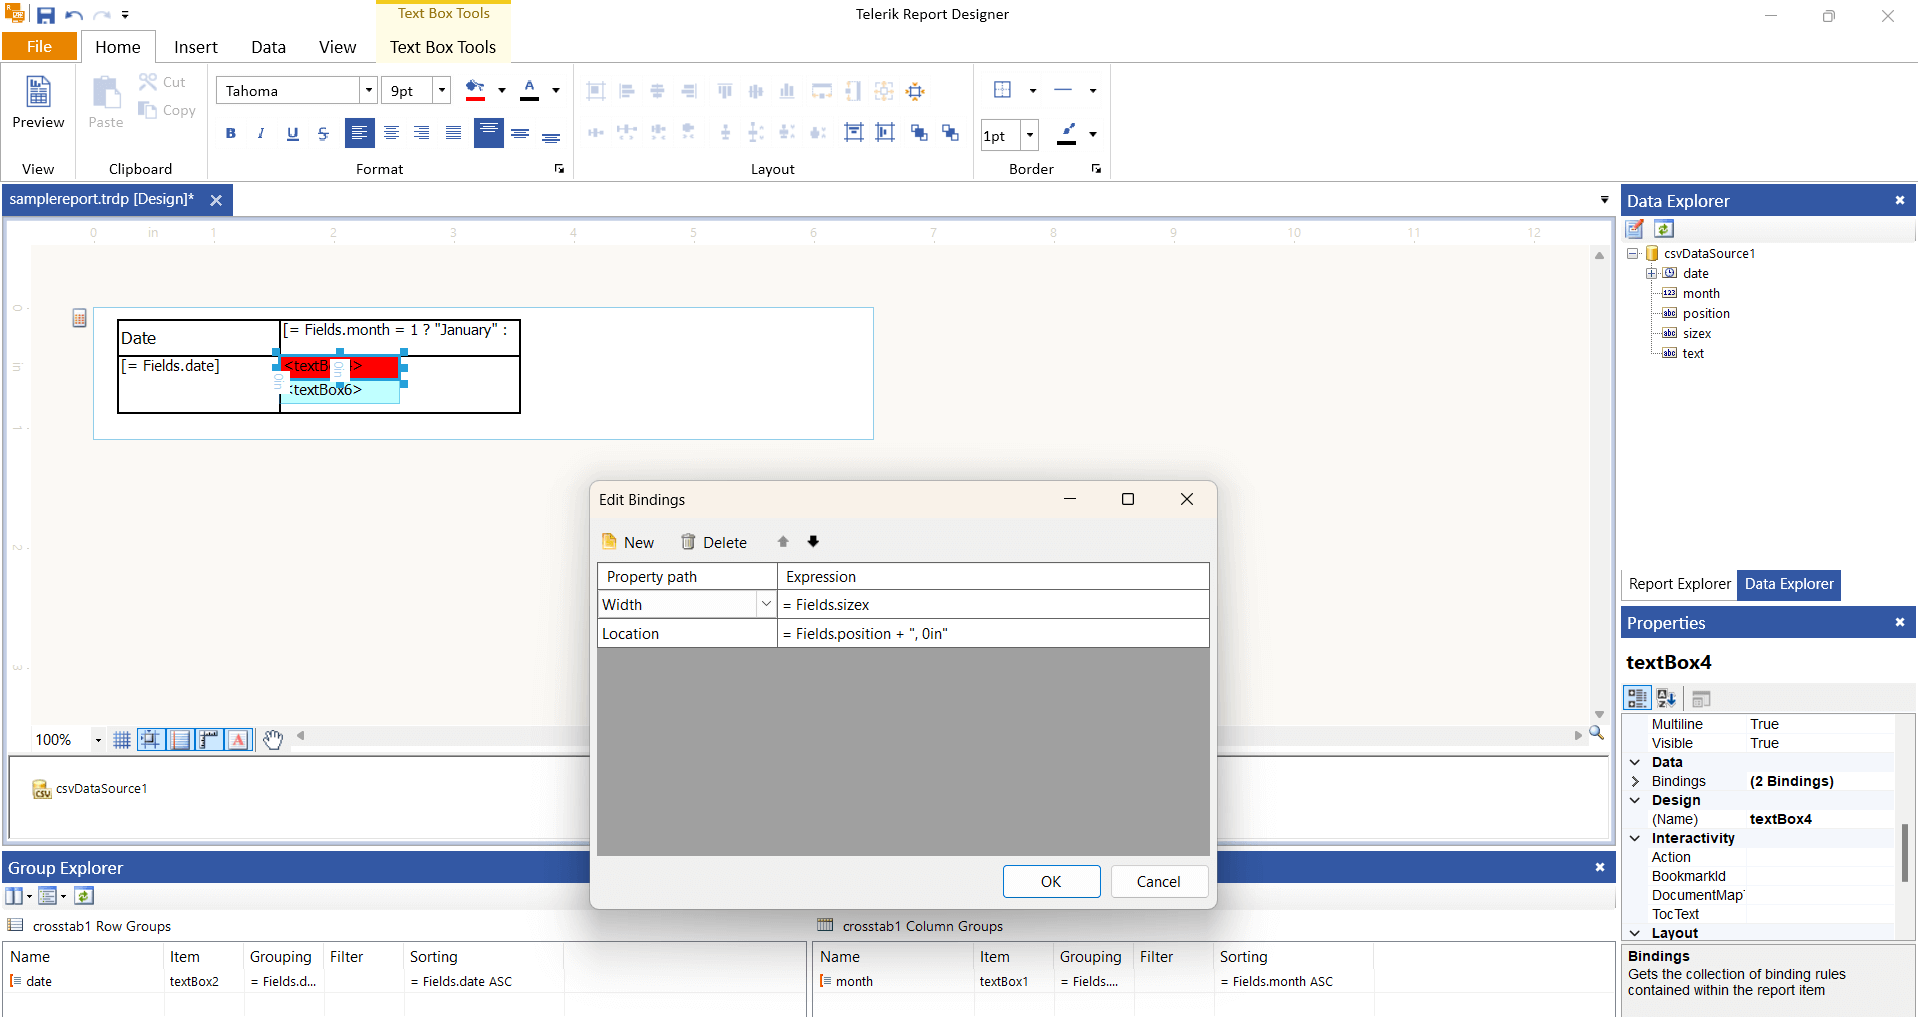
- Bind the Location and Width of each TextBox dynamically using Bindings. This ensures the rectangles are rendered proportionally based on the date range extracted from the data.
Example
Below is an example dataset and binding configuration:
Sample Data:
text,date,month,sizex,position
1,01/01/2025,1,0.5in,1.5in
1,01/01/2025,2,0.3in,0in
Ensure that the data includes the X and Y positions, and the sizes of the range bars. These values determine the length of the colored textbox that is being used to represent the range bar.
Sample Report
Download the rendering-layered-date-range-backgrounds.trdp report definition.