Maps with Custom Polygons
Environment
| Product Version | All | |
| Product | Progress® Telerik® Reporting | Map Report Item |
Description
How can I create a Map report item with custom-defined shapes?
Solution
The Map item processes and renders polygon primitives by using the ShapeMapSeries property, which accepts Well-known text and Well-known binary, or ESRI Shapefile as a source. Since creating ESRI Shapefiles requires additional tools, the suggested implementation will use the WKT polygon representation. The resulting report will display three American states whose coordinates will be obtained from a CSV data source.
- You will use the Choropleth wizard that will create the ShapeMap series instance. Start it either by selecting the Choropleth Wizard icon from the Data Presentation Templates section or from the Insert menu in the Standalone Report Designer.
- Add a new CSV data source and name it statesData. This data source will hold the information about the state name and their WKT-coordinates. Click OK to continue with the data source wizard.
-
On the Choose a CSV Source page, paste the following text in the Enter CSV as text tab:
State;WKT
North Dakota;POLYGON((-104.064281 49.004828,-104.064281 45.945270,-96.557949 45.945270,-96.796902 46.641745,-96.763943 46.935113,-96.840847 47.006332,-96.879299 47.620830,-97.151211 48.176931,-97.105495 48.689066,-97.231838 49.004828,-104.064281 49.004828))
Wyoming;POLYGON((-111.064309 45.005438,-111.064309 41.006683,-104.066018 41.006683,-104.066018 45.005438,-111.064309 45.005438))
New Mexico;POLYGON((-109.065510 37.006785,-109.051777 31.332360,-108.208414 31.333407,-108.208493 31.783783,-106.528509 31.783783,-106.645607 31.896072,-106.614021 31.921719,-106.621574 31.971244,-106.638054 31.982311,-106.618623 32.000556,-103.064750 32.000519,-103.041428 36.500404,-103.002656 36.500529,-103.002220 36.999981,-109.065510 37.006785))
The WKT consists of closed polygons, that is, the last point coincides with the first one, which are enumerated in a counter-clockwise order. For more information, refer to the OGC 10-032r8 specification.
Click Next when ready.
On the Configure the separators page, check only the Semicolon option and click Next.
- Skip the Escape Format page by clicking Next.
- On the CSV Headers page, tick the The CSV has headers option. Click Next.
- On the Map columns to type page, you will see the
StateandWKTcolumns that have thestringtype. The Data preview box will be displaying the formatted output of the CSV data. If everything is correct, close the wizard by clicking Finish. - The data source wizard closes and the Choropleth Wizard activates, displaying the
statesDatadata source you just created. Click Next. - On the Choose a spatial data source page, select the
Well-Known-Text or Well-Known-Binary field from the data sourceoption and choose theWKTfield in the combo-box. Click Next. - The Choropleth setup expects to configure the fields required to create a Choropleth. Since the data source doesn't include any analytical information that can be used, drag one of the two available fields in the Color data field box. Click Finish.
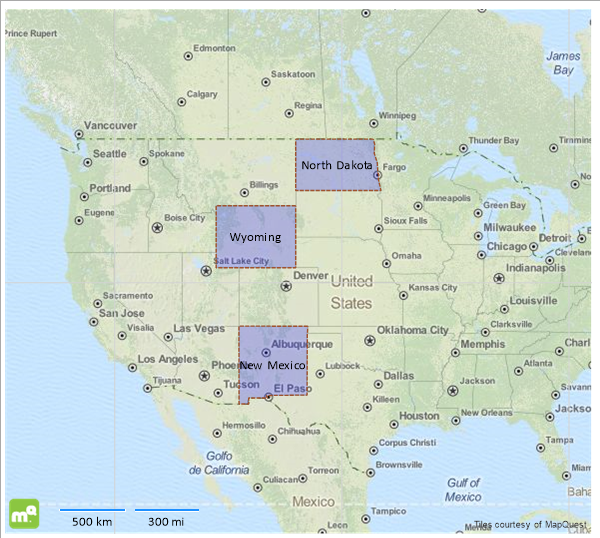
- When the wizard closes, the Map item will display the three polygons that roughly represent the state borders of North Dakota, Wyoming, and New Mexico. Depending on your scenario, you can set up a
TileProviderand add some additional styling to the data points and the Map:
Here is how the final Map should look like: