How to display multiple ranges per series in a Range Bar graph
Environment
| Product | Progress® Telerik® Reporting |
Description
By default, the Range Bar graph wizard will display only the last data instance of a given Category.
This means that if a category has more than 1 data record associated with it, instead of creating a range bar for each, only the last one will be rendered while the rest will be omitted.
In this article, we will explain how to setup the Graph item so that it is able to render more than one range per category.
For the example, that we will be preparing, we have decided to use the following data:
Start,End,Category
0,540,A
540,600,B
600,1020,C
1020,1080,D
1080,1439,A
Solution
-
First, let's create a new
Range Bargraph from theInsertmenu on the top. The graph fields may look as follows: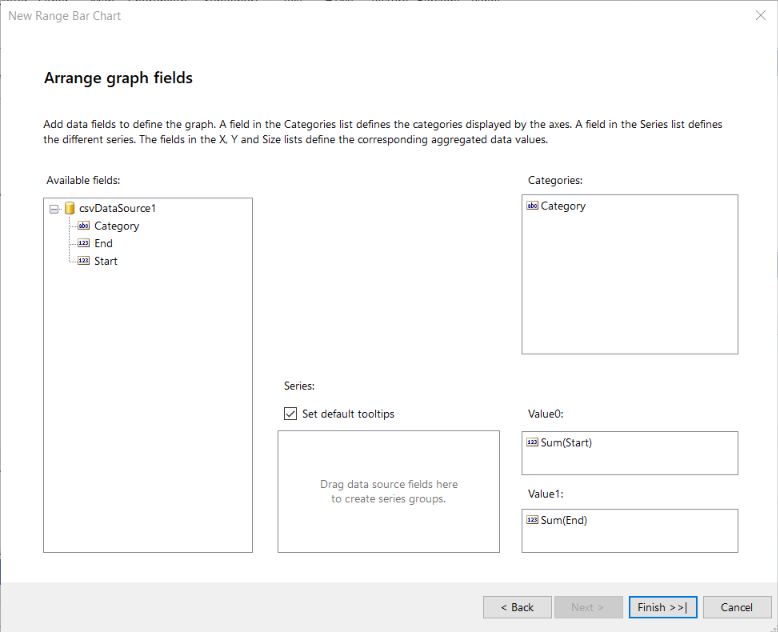
-
In order to force the Graph to render multiple ranges per series, we will now need to create an empty series group:
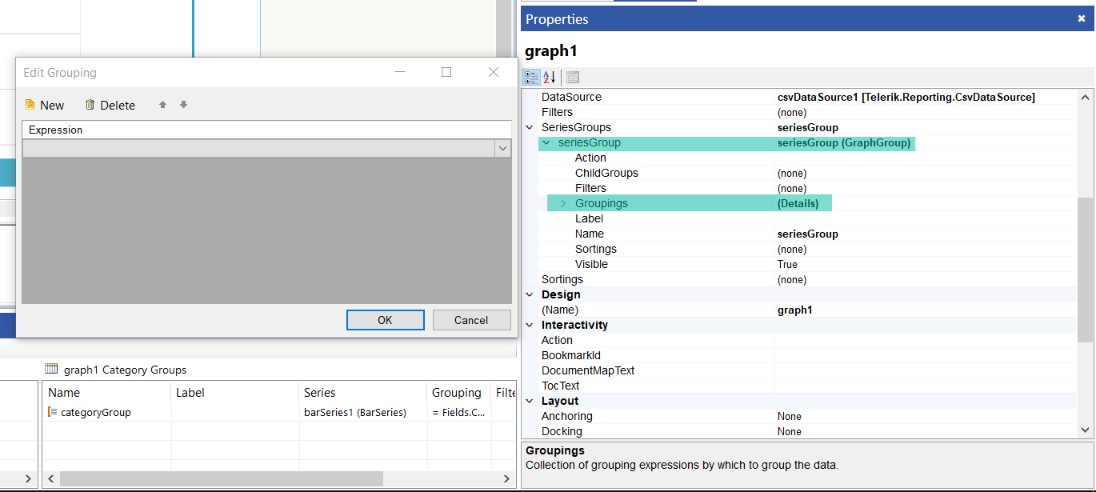
The multiple ranges will now be displayed, however, they will be at different positions vertically.
-
Set GraphSeries.ArrangeMode to
Overlapped. Now, the series will be at the same vertical position.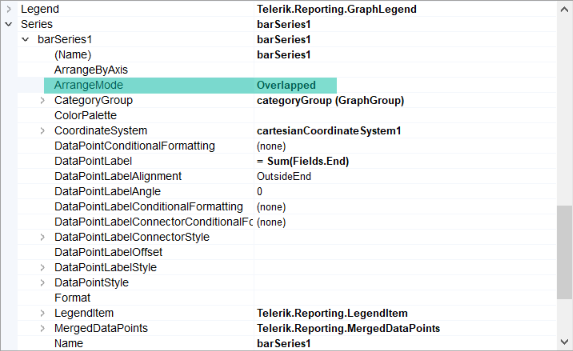
Because of the
SeriesGroupthat we created, all ranges will now have their own colors. To fix that, we may create a new ColorPalette with only one color.Considering that we have an empty series group, we may hide the
GraphLegendby selecting it and then fromStylesettingVisibletoFalse.