Create a graph with a merged last column that can expand and collapse
Environment
| Product Version | 12.2.18.912+ |
| Product | Progress® Telerik® Reporting |
Description
This KB article explains the steps to create a graph whose last column contains merged values. It can collapse and expand on click.
Solution
-
Add a report parameter from type Boolean. Set it as follows:
- AutoRefresh : True
- Name : paramMerged
- Value : True
-
Add the Graph. Click on the barSeries and from the Property grid -> Layout -> expand MergedDataPoints. Apply the setting below:
- MergeModel: SingleSlice
- TresholdMode: Count
- TresholdValue:
= IIf(Parameters.paramMerged.Value = "True", 5, 120)In this expression, the value which will be set when the report parameter is True is 5 and stands for the number of Series (with highest values) that will be separately displayed - the rest will be merged. 120 stands for the value of the columns that will be shown when we would like to display all the Series in the Graph - it should be bigger than the total number of columns.
-
Add a textbox and set its Value as follows:
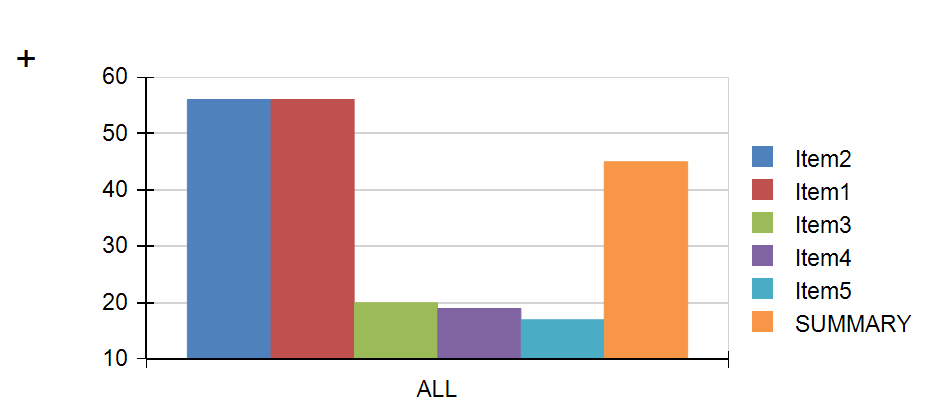
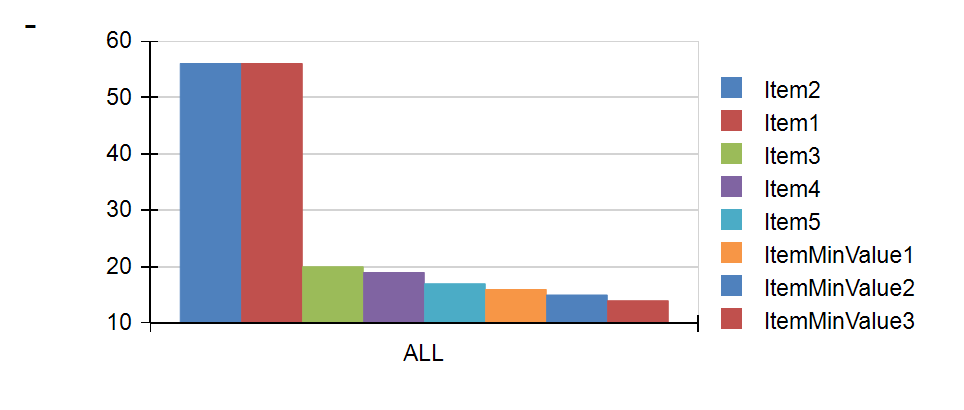
= IIf(Parameters.paramMerged.Value = 'True', "+", "-")This way, + will be shown when the columns are merged and - when they are expanded.
-
Add a Drillthrough Report Action to the textbox which will point to the same report (i.e. to itself): Action -> Navigate to Report -> Select a report source -> URL or file -> fill the path to the report ->Edit Parameters:
- Parameter Name: paramMerged
- Parameter Value: = Parameters.paramMerged.Value = 'False'
The result will be: