Displaying Column Totals and Formatting Dates in Column Chart
Environment
| Product | Reporting |
Description
I want to display the total for each month at the top of the column in a Column Chart and format the month and year at the bottom of the X-axis. I need steps to achieve this functionality.
Solution
To display the monthly totals at the top of each column and format the X-axis dates:
-
Change the
DataPointStyleproperty to make it visible. This ensures that the total values appear above the columns.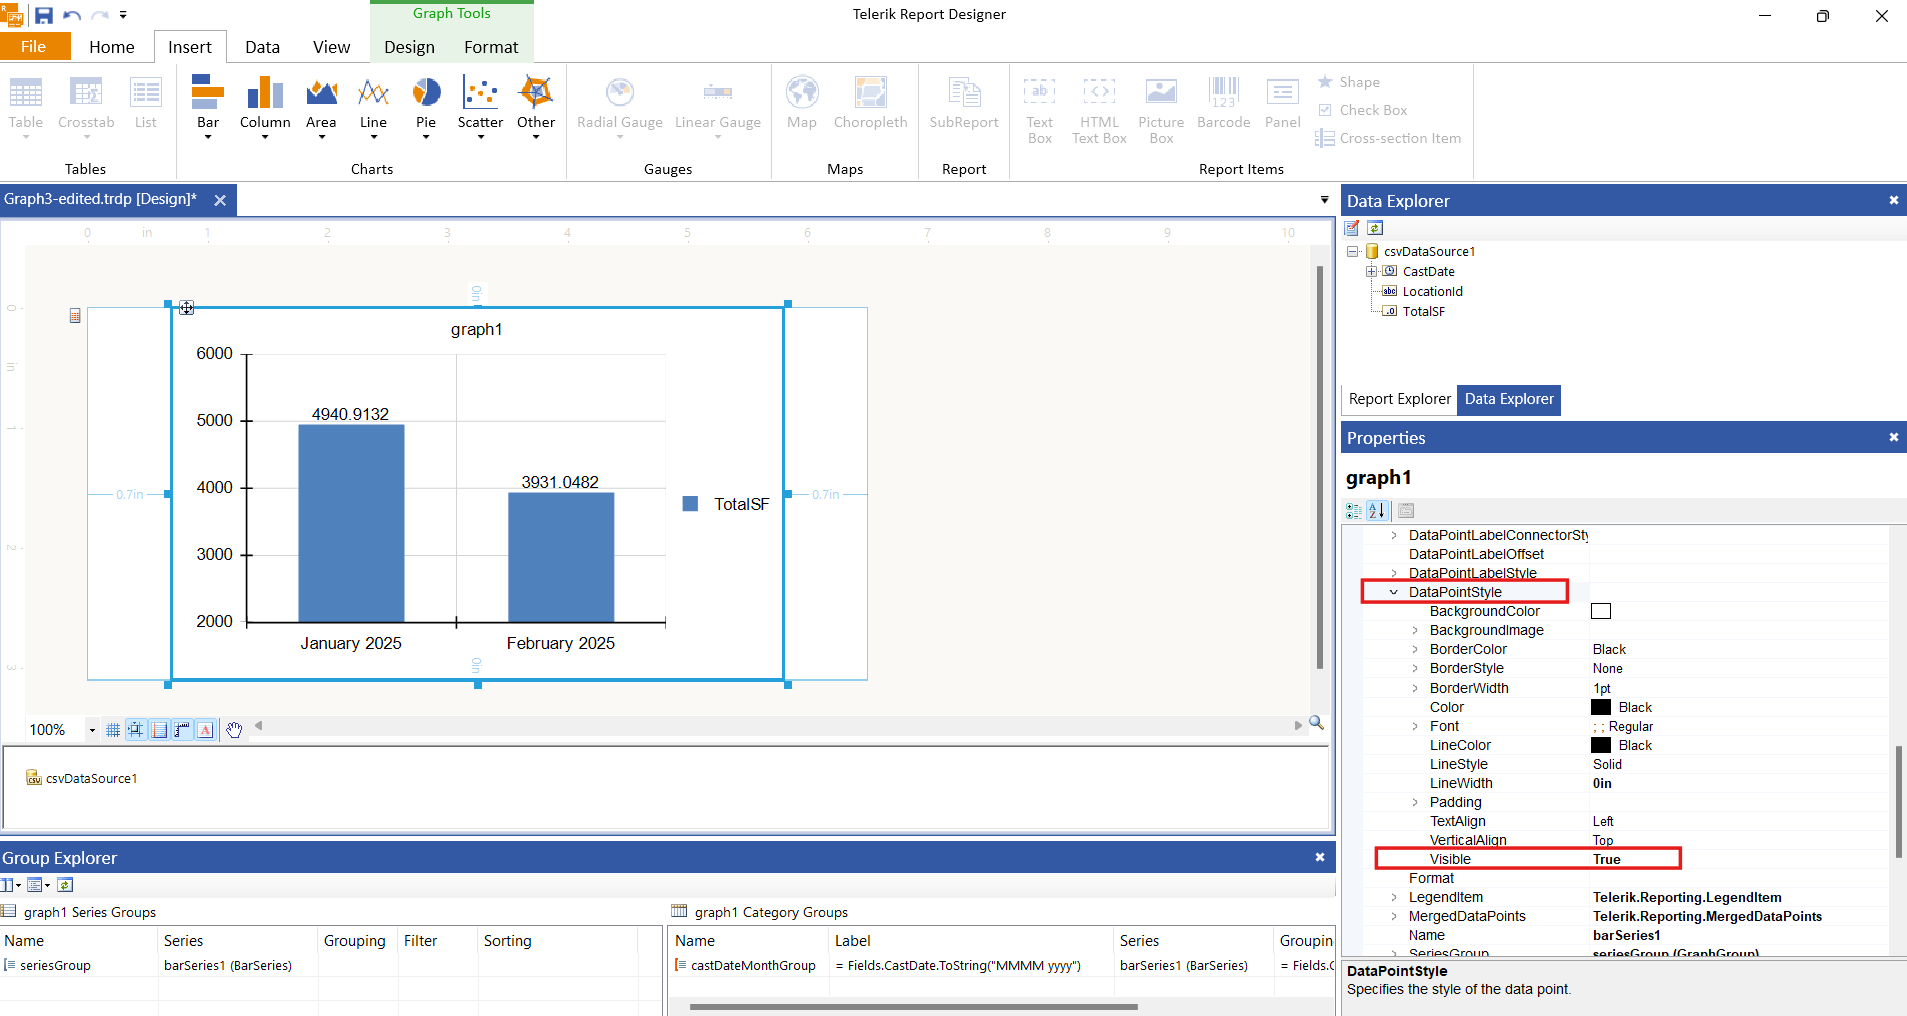
-
Use the
Labelproperty of the category group to format the month and year display on the X-axis. Set the property to the following expression:= Fields.CastDate.ToString("MMMM yyyy")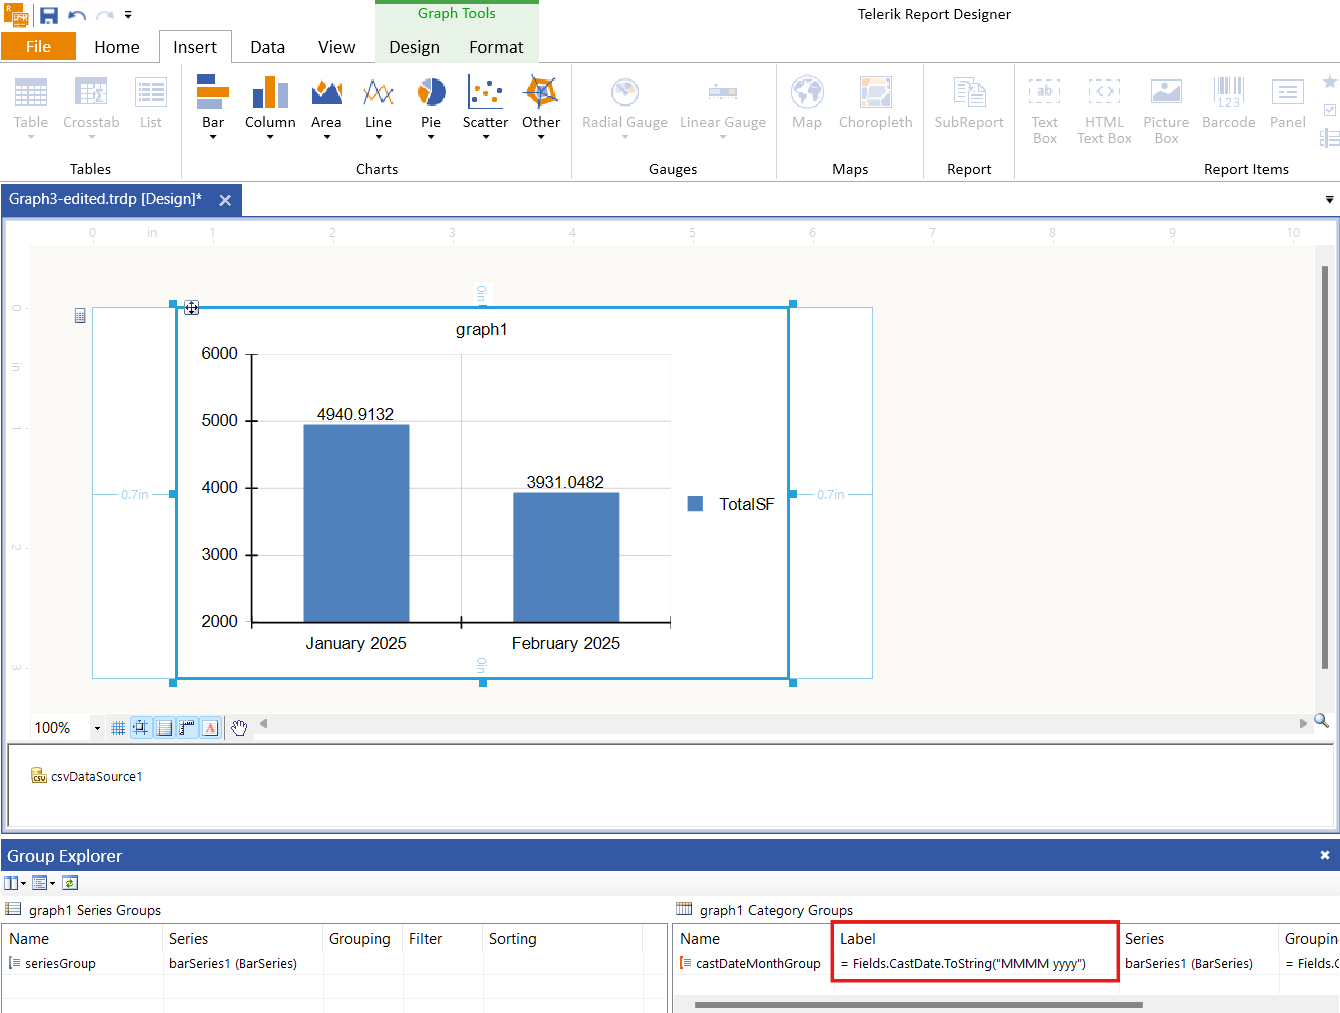
These steps ensure that the monthly totals appear at the top of each column and the X-axis displays the formatted month and year.