Displaying a Triangle Matrix Table Design in Telerik Reporting
Environment
| Property | Value |
|---|---|
| Product | Telerik Reporting |
Description
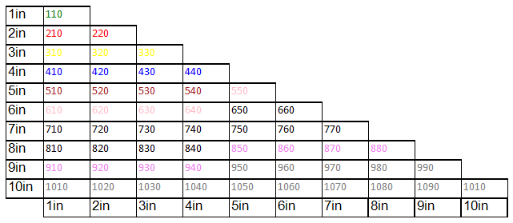
I want to display a triangle matrix table design in Telerik Reporting. The matrix should have left and bottom header rows with identical content that represents the size in inches as in the next image:

Solution
You can achieve the desired layout by using a proper DataSource that includes empty or Null records for the matrix cells that shouldn't be displayed. The Reporting product is data-driven, so the table/crosstab layout depends on the received data.
To display a triangle matrix table design, follow these steps:
- Use a proper DataSource that includes Null or empty values for the top-right area of the matrix. For example, you can use a CsvDataSource with columns
RowSize,ColumnSize, andValue. TheRowSizeandColumnSizefields represent the Crosstab Row and Column Headers, while theValuefield holds the data for each cell. Set theValueas an empty string when theColumnSizeis larger than theRowSize. - Add a Crosstab to your report and configure the Row grouping by
RowSizeand Column grouping byColumnSize. Make sure to set the Crosstab Border Styles toNone. - Set the Border Styles of the row header cells to
Solid. This includes the cell on the second row/first column with the value '= Fields.RowSize'. - Hide the Row Header of the Crosstab by setting the
Visibleproperty toFalse. - Add a Row Footer to the Crosstab to display the sizes at the bottom of the matrix. Right-click on the last Crosstab row and select 'Insert Row > Outside Group > Below'. Set the Default Border Style of the new row's right cell to
Solid. -
For the detail cell of the Crosstab (middle row/right column) with the value '= Fields.Value', use a Binding to set the
Style.BorderStyle.Defaultproperty as follows. The Expression ensures borders are displayed only for the cells with content, i.e. that are part of the desired triangle matrix:= (Fields.Value is Null) Or (Fields.Value = "") ? "None" : "Solid" -
You can also use a second Binding for the same cell to set the font color (Style.Color) based on the value. For example, you can set different colors based on specific ranges of values like in the referenced sample report:
= (Fields.Value is Null) Or (Fields.Value = "") ? "white" : Ifs(
    Fields.Value < 150, "green",
    Fields.Value < 250, "red",
    Fields.Value < 350, "yellow",
    Fields.Value < 450, "blue",
    Fields.Value < 550, "brown",
    Fields.Value < 650, "pink",
    Fields.Value < 750, "black",
    Fields.Value < 850, "light green",
    Fields.Value < 950, "violet",
    "gray")