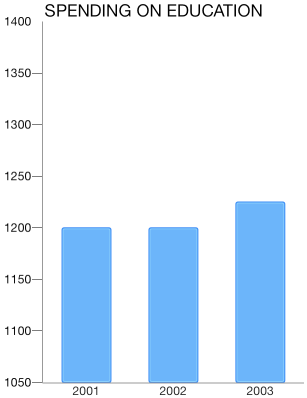
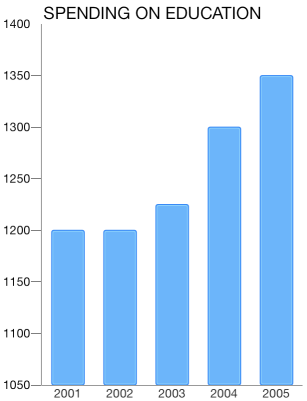
Chart for Xamarin.iOS: Datetime Axis
TKChartDateTimeAxis categoric axis is an axis with NSDate values sorted chronologically. It also allows definitions of categories based on specific date time components – year, month, day etc. For example, if data values fall in the range of one year, the points can be plotted in categories for each month. If data values fall in the range of one month, the values can be categorized by days. It also introduces several important properties:
MajorTickInterval- defines an interval between major axis ticks.Baseline- defines how the series data should be aligned. For example: TheTKChartBarSeriesmight render its bars up and down depending on whether its value is greater or less than the baseline value.Offset- determines an axis value where the axis is crossed with another axis.
Configure a TKChartDateTimeAxis
You can configure a date-time axis by initializing it and setting it as the main x-axis or y-axis of the chart:
TKChartDateTimeAxis xAxis = new TKChartDateTimeAxis (minDate, maxDate);
xAxis.MajorTickIntervalUnit = TKChartDateTimeAxisIntervalUnit.Months;
xAxis.MajorTickInterval = 1;
You can define the axis categories by changing the interval unit property to one of the following values:
- TKChartDateTimeAxisIntervalUnit.Seconds
- TKChartDateTimeAxisIntervalUnit.Minutes
- TKChartDateTimeAxisIntervalUnit.Hours
- TKChartDateTimeAxisIntervalUnit.Days
- TKChartDateTimeAxisIntervalUnit.Weeks
- TKChartDateTimeAxisIntervalUnit.Months
- TKChartDateTimeAxisIntervalUnit.Years
- TKChartDateTimeAxisIntervalUnit.Custom

Setting a plotting mode of axis
The TKChartAxisPlotMode is used by the axis to plot the data. Possible values are TKChartAxisPlotMode.BetweenTicks and TKChartAxisPlotMode.OnTicks. TKChartAxisPlotMode.BetweenTicks plots points in the middle of the range, defined by two ticks. OnTicks plots the points over each tick.
You should use the following lines of code to alter this behavior:
xAxis.PlotMode = TKChartAxisPlotMode.BetweenTicks;
