How to Add Chart Title to RadChartView
Environment
| Product Version | 2019.2.618 |
| Product | RadChartView for WPF |
Description
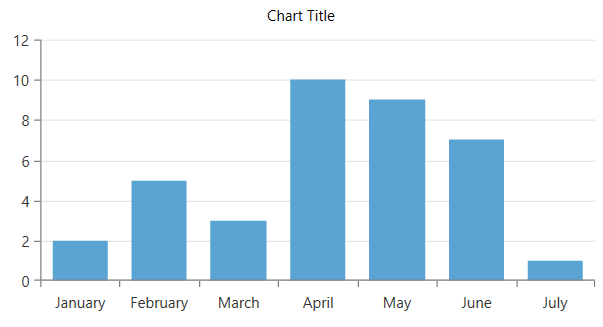
How to add a title to RadCartesianChart.
Solution
To add a title, add the chart and a TextBlock in a Grid panel with two RowDefinitions.
<Grid>
    <Grid.RowDefinitions>
        <RowDefinition Height="Auto"/>
        <RowDefinition Height="*"/>
    </Grid.RowDefinitions>

    <TextBlock Text="Chart Title" HorizontalAlignment="Center"/>

    <telerik:RadCartesianChart Grid.Row="1">
        <telerik:RadCartesianChart.VerticalAxis>
            <telerik:LinearAxis/>
        </telerik:RadCartesianChart.VerticalAxis>
        <telerik:RadCartesianChart.HorizontalAxis>
            <telerik:CategoricalAxis />
        </telerik:RadCartesianChart.HorizontalAxis>
        <telerik:RadCartesianChart.Grid>
            <telerik:CartesianChartGrid MajorLinesVisibility="Y" />
        </telerik:RadCartesianChart.Grid>
        <telerik:RadCartesianChart.Series>
            <telerik:BarSeries>
                <telerik:BarSeries.DataPoints>
                    <telerik:CategoricalDataPoint Category="January" Value="2" />
                    <telerik:CategoricalDataPoint Category="February" Value="5" />
                    <telerik:CategoricalDataPoint Category="March" Value="3" />
                    <telerik:CategoricalDataPoint Category="April" Value="10" />
                    <telerik:CategoricalDataPoint Category="May" Value="9" />
                    <telerik:CategoricalDataPoint Category="June" Value="7" />
                    <telerik:CategoricalDataPoint Category="July" Value="1" />
                </telerik:BarSeries.DataPoints>
            </telerik:BarSeries>
        </telerik:RadCartesianChart.Series>
    </telerik:RadCartesianChart>
</Grid>