Styling the Axis Line
The approach below allow you more completely to change the appearance of the axis lines, but if you want to change only the color of it, you can use the AxisElementBrush property of the RadChart.Note that the value of this property will get applied to all of the axes and all of the tick lines as well.
The axis line is part of the chart axis and is represented by the Line control. To create a style for it in Expression Blend use a dummy control and after modifying it, set it to the AxisStyles complex property of the Axis.
Open your RadChart project in Expression Blend. To add the dummy Line control you have to go to the XAML view. To do that select from the menu View -> Active Document View -> XAML View. Declare a Line control in your XAML.
<Grid x:Name="LayoutRoot"
      Background="White">
    <!--...-->
    <Line />
</Grid>
To go back to the design view select View -> Active Document View -> Design View from the menu. In the 'Objects and Timeline' pane select the newly created Line control. And from the menu select *Object -> Edit Style -> Create Empty. *You will be prompted for the name of the style and where to be placed within your application.
If you choose to define the style in Application, it would be available for the entire application. This allows you to define a style only once and then reuse it where needed.
After clicking the OK button, a style with target type Line will be created and the properties for this type will be loaded in the 'Properties' pane. Modify them until you get the desired appearance.
After finishing with the changes, it is time to set the style. It can be set only through the procedural code, which means that you have to go to the Visual Studio and modify the code-behind file of your UserControl.
this.radChart.DefaultView.ChartArea.AxisX.AxisStyles.AxisLineStyle = this.Resources[ "AxisLineStyle" ] as Style;
this.radChart.DefaultView.ChartArea.AxisY.AxisStyles.AxisLineStyle = this.Resources[ "AxisLineStyle" ] as Style;
Me.radChart.DefaultView.ChartArea.AxisX.AxisStyles.AxisLineStyle = TryCast(Me.Resources("AxisLineStyle"), Style)
Me.radChart.DefaultView.ChartArea.AxisY.AxisStyles.AxisLineStyle = TryCast(Me.Resources("AxisLineStyle"), Style)
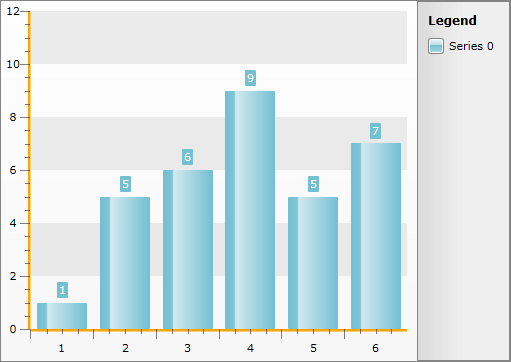
Here is a snapshot of the sample result.

Here is the final XAML generated by Expression Blend:
<Style x:Key="AxisLineStyle" TargetType="Line">
    <Setter Property="Stroke" Value="Orange"/>
    <Setter Property="StrokeThickness" Value="5"/>
</Style>
Change Axis foreground color, when clicking on Axis Item Label
Sometimes, when clicking on the XAxis label, one may need to alter some of the appearance settings of the axis. One such setting is the foreground color. Let us assume, that the chart declaration looks like this:
<telerik:RadChart x:Name="RadChart1">
    <telerik:RadChart.DefaultView>
        <telerik:ChartDefaultView>
            <telerik:ChartDefaultView.ChartArea>
                <telerik:ChartArea x:Name="Area" LegendName="legend">
                    <telerik:ChartArea.DataSeries >
                        <telerik:DataSeries LegendLabel="Series1" >
                            <telerik:DataPoint XCategory="Jan" YValue="100"/>
                            <telerik:DataPoint XCategory="Feb" YValue="10"/>
                            <telerik:DataPoint XCategory="Mar" YValue="40"/>
                            <telerik:DataPoint XCategory="Apr" YValue="89"/>
                        </telerik:DataSeries>
                        <telerik:DataSeries LegendLabel="Series2">
                            <telerik:DataPoint XCategory="Jan" YValue="70"/>
                            <telerik:DataPoint XCategory="Feb" YValue="31"/>
                            <telerik:DataPoint XCategory="Mar" YValue="67"/>
                            <telerik:DataPoint XCategory="Apr" YValue="54"/>
                        </telerik:DataSeries>
                    </telerik:ChartArea.DataSeries>
                </telerik:ChartArea>
            </telerik:ChartDefaultView.ChartArea>
            <telerik:ChartDefaultView.ChartLegend>
                <telerik:ChartLegend x:Name="legend"/>
            </telerik:ChartDefaultView.ChartLegend>
        </telerik:ChartDefaultView>
    </telerik:RadChart.DefaultView>
</telerik:RadChart>
The first step is to select a suitable event, where to handle this logic. One possible option, is the mouse down event handler. It is added when the application is initializing:
RadChart1.AddHandler(MouseLeftButtonDownEvent, new MouseButtonEventHandler(MouseLeftButtonDownEventHandler), true);
RadChart1.AddHandler
The code, essential to the functionality at hand is listed below:
public void MouseLeftButtonDownEventHandler(object sender, MouseButtonEventArgs e)
{
    TextBlock txtBlock = e.OriginalSource as TextBlock;
    if (txtBlock == null)
        return;

    var axis = txtBlock.GetVisualParent<AxisX2D>();
    if (axis != null)
    {
        axis.Foreground = new SolidColorBrush(Colors.Red);
    }
}
Public Sub MouseLeftButtonDownEventHandler(sender As Object, e As MouseButtonEventArgs)
    Dim txtBlock As TextBlock = TryCast(e.OriginalSource, TextBlock)
    If txtBlock Is Nothing Then
        Return
    End If
    Dim axis = txtBlock.GetVisualParent(Of AxisX2D)()
    If axis IsNot Nothing Then
        axis.Foreground = New SolidColorBrush(Colors.Red)
    End If
End Sub
The approach uses the exposed property of the AxisX2D object, to directly alter the foreground of the XAxis, once the end user clicks on any of the text blocks along it. The result:
