Integration with RadGridView
The Telerik RadChart supports great integration with other controls. This tutorial will show you how to integrate RadChart with RadGridView.
The final result should look like the snapshots below:

This tutorial will use the Northwind database, which can be downloaded from here.
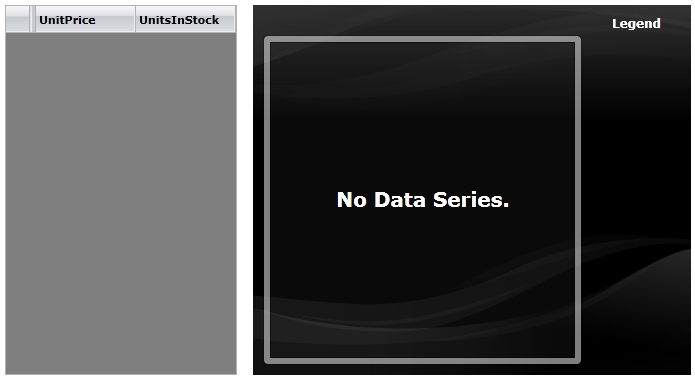
- Here is the initial staging:
<Grid x:Name="LayoutRoot" Background="White">
    <Grid.ColumnDefinitions>
        <ColumnDefinition Width="Auto"/>
        <ColumnDefinition Width="*"/>
    </Grid.ColumnDefinitions>
    <telerik:RadGridView Margin="8"
                         AutoGenerateColumns="False" SelectionMode="Extended"
                         IsReadOnly="True" ShowGroupPanel="False">
        <telerik:RadGridView.Columns>
           <telerik:GridViewDataColumn DataMemberBinding="{Binding UnitPrice}"/>
           <telerik:GridViewDataColumn DataMemberBinding="{Binding UnitsInStock}"/>
        </telerik:RadGridView.Columns>
    </telerik:RadGridView>
    <telerik:RadChart x:Name="radChart" Grid.Column="1" Margin="8"/>
</Grid>
On the left side you have a RadGridView, where the UnitPrice and UnitsInStock properties from the Products table in the Northwind database will be displayed. When you select a single row, a bar chart will be generated to compare both of the parameters. If you select several rows, then a line chart will be generated.
- Populate the RadGridView control with all products from the Northwind database. Here is a sample code how to do that:
public class NorthwindDataSource
{
    private static NorthwindEntities northwindEntity;
    public NorthwindDataSource()
    {
        northwindEntity = new NorthwindEntities( new Uri( "http://localhost:52981/Services/SampleAdoNetDataService.svc/" ) );
        this.Products = new ObservableCollection<Products>();

        var query = from p in northwindEntity.Products
                    select p;

        DataServiceQuery<Products> products = ( DataServiceQuery<Products> )query;

        products.BeginExecute(
           (IAsyncResult result) => EntitiesLoaded<Products>( result, this.Products ), products );
    }

    public ObservableCollection<Products> Products
    {
        get;
        set;
    }

    private static void EntitiesLoaded<T>(IAsyncResult result, Collection<T> entities )
    {
        DataServiceQuery<T> query = result.AsyncState as DataServiceQuery<T>;
        foreach ( T entity in query.EndExecute( result ) )
        {
            entities.Add( entity );
        }
    }
}
public class NorthwindDataSource
{
    private static NorthwindEntities northwindEntity;
    public NorthwindDataSource()
    {
        northwindEntity = new NorthwindEntities( new Uri( "http://localhost:52981/Services/SampleAdoNetDataService.svc/" ) );
        this.Products = new ObservableCollection<Products>();

        foreach ( Products p in northwindEntity.Products.Execute() )
        {
            this.Products.Add( p );
        }
    }

    public ObservableCollection<Products> Products
    {
        get;
        set;
    }
}
Public Class NorthwindDataSource
    Private Shared northwindEntity As NorthwindEntities

    Public Sub New()
        northwindEntity = New NorthwindEntities(New Uri("http://localhost:52981/Services/SampleAdoNetDataService.svc/"))
        Me.Products = New ObservableCollection(Of Products)()
        For Each p As Products In northwindEntity.Products.Execute()
            Me.Products.Add(p)
        Next
    End Sub

    Private _Products As ObservableCollection(Of Products)
    Public Property Products() As ObservableCollection(Of Products)
        Get
            Return _Products
        End Get
        Set(ByVal value As ObservableCollection(Of Products))
            _Products = value
        End Set
    End Property
End Class
Public Class NorthwindDataSource
    Private Shared northwindEntity As NorthwindEntities

    Public Sub New()
        northwindEntity = New NorthwindEntities(New Uri("http://localhost:52981/Services/SampleAdoNetDataService.svc/"))
        Me.Products = New ObservableCollection(Of Products)()

        Dim query = From p In northwindEntity.Products _
            Select p

        Dim products As DataServiceQuery(Of Products) = DirectCast(query, DataServiceQuery(Of Products))
        products.BeginExecute(Sub(result As IAsyncResult) EntitiesLoaded(Of Products)(result, Me.Products), products)
    End Sub

    Private _Products As ObservableCollection(Of Products)
    Public Property Products() As ObservableCollection(Of Products)
        Get
            Return _Products
        End Get
        Set(ByVal value As ObservableCollection(Of Products))
            _Products = value
        End Set
    End Property

    Private Shared Sub EntitiesLoaded(Of T)(ByVal result As IAsyncResult, ByVal entities As Collection(Of T))
        Dim query As DataServiceQuery(Of T) = TryCast(result.AsyncState, DataServiceQuery(Of T))
        For Each entity As T In query.EndExecute(result)
            entities.Add(entity)
        Next
    End Sub
End Class
Declare the NorthwindDataSource class as a resource in your application and set it as an ItemsSource for the gridview.
<FrameworkElement.Resources>
    <example:NorthwindDataSource x:Key="DataSource"/>
</FrameworkElement.Resources>
<telerik:RadGridView Margin="8"
AutoGenerateColumns="False" SelectionMode="Multiple"
IsReadOnly="True" ShowGroupPanel="False"
ItemsSource="{Binding Source={StaticResource DataSource}, Path=Products}" />
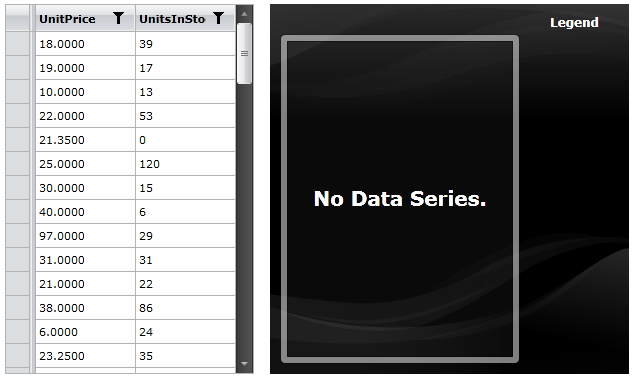
Here is the result so far:
The next step is to build the bar chart (comparing the UnitPrice and UnitsInStock parameters) depending on the selected row(s) in the gridview.
Attach to the SelectionChanged event of the RadGridView.
<telerik:RadGridView x:Name="radGridView" Margin="8"
AutoGenerateColumns="False" SelectionMode="Multiple"
IsReadOnly="True" ShowGroupPanel="False"
ItemsSource="{Binding Source={StaticResource DataSource}, Path=Products}"
SelectionChanged="radGridView_SelectionChanged" />
- Switch to the code-behind and add the following code in the event handler. It aims to get all the selected products and to build the chart.
private void radGridView_SelectionChanged(object sender, SelectionChangeEventArgs e)
{
    Collection<Products> selectedList = new Collection<Products>();

    // Get all selected Items
    foreach (Products product in radGridView.SelectedItems)
    {
        selectedList.Add(product);
    }

    CreateSeriesMappings(selectedList);
    SetChartItemsSource(selectedList);
}
Private Sub radGridView_SelectionChanged(ByVal sender As Object, ByVal e As SelectionChangeEventArgs)
    Dim selectedList As New Collection(Of Products)()
    ' Get all selected Items '

    For Each product As Products In radGridView.SelectedItems
        selectedList.Add(product)
    Next

    CreateSeriesMappings(selectedList)
    SetChartItemsSource(selectedList)
End Sub
- Here is the code for the CreateSeriesMapping method. It builds the RadChart control based on the selected products. If there is only one product that is selected, then the result will be a BarChart comparing the UnitPrice and the UnitsInStock parameters. If there are two or more products that are selected, then the result will be a LineChart.
private void CreateSeriesMappings( Collection<Products> invoicesList )
{
    radChart.SeriesMappings.Clear();

    SeriesMapping seriesMapping = new SeriesMapping();
    seriesMapping.SeriesDefinition = invoicesList.Count < 2 ? ( ISeriesDefinition )new BarSeriesDefinition() : ( ISeriesDefinition )new LineSeriesDefinition();
    seriesMapping.LegendLabel = "Product In Stock";

    ItemMapping itemMapping = new ItemMapping();
    itemMapping.DataPointMember = DataPointMember.YValue;
    itemMapping.FieldName = "UnitsInStock";
    seriesMapping.ItemMappings.Add( itemMapping );

    SeriesMapping seriesMapping1 = new SeriesMapping();
    seriesMapping1.SeriesDefinition = invoicesList.Count < 2 ? ( ISeriesDefinition )new BarSeriesDefinition() : ( ISeriesDefinition )new LineSeriesDefinition();
    seriesMapping1.LegendLabel = "Product Price";

    ItemMapping itemMapping1 = new ItemMapping();
    itemMapping1.DataPointMember = DataPointMember.YValue;
    itemMapping1.FieldName = "UnitPrice";
    seriesMapping1.ItemMappings.Add( itemMapping1 );

    radChart.SeriesMappings.Add( seriesMapping );
    radChart.SeriesMappings.Add( seriesMapping1 );
}
Private Sub CreateSeriesMappings(ByVal invoicesList As Collection(Of Products))
    radChart.SeriesMappings.Clear()

    Dim seriesMapping As New SeriesMapping()
    seriesMapping.SeriesDefinition = If(invoicesList.Count < 2, DirectCast(New BarSeriesDefinition(), ISeriesDefinition), DirectCast(New LineSeriesDefinition(), ISeriesDefinition))
    seriesMapping.LegendLabel = "Product In Stock"

    Dim itemMapping As New ItemMapping()
    itemMapping.DataPointMember = DataPointMember.YValue
    itemMapping.FieldName = "UnitsInStock"
    seriesMapping.ItemMappings.Add(itemMapping)

    Dim seriesMapping1 As New SeriesMapping()
    seriesMapping1.SeriesDefinition = If(invoicesList.Count < 2, DirectCast(New BarSeriesDefinition(), ISeriesDefinition), DirectCast(New LineSeriesDefinition(), ISeriesDefinition))
    seriesMapping1.LegendLabel = "Product Price"

    Dim itemMapping1 As New ItemMapping()
    itemMapping1.DataPointMember = DataPointMember.YValue
    itemMapping1.FieldName = "UnitPrice"
    seriesMapping1.ItemMappings.Add(itemMapping1)

    radChart.SeriesMappings.Add(seriesMapping)
    radChart.SeriesMappings.Add(seriesMapping1)
End Sub
- The SetChartItemsSource method does only one thing - it sets the ItemsSource of the chart.
private void SetChartItemsSource( Collection<Products> invoicesList )
{
    radChart.ItemsSource = invoicesList;
}
Private Sub SetChartItemsSource(ByVal invoicesList As Collection(Of Products))
    radChart.ItemsSource = invoicesList
End Sub
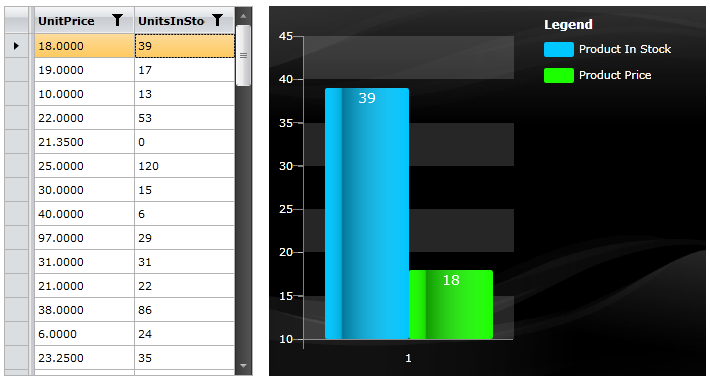
Here is the final result, when you select single row from the grid view:

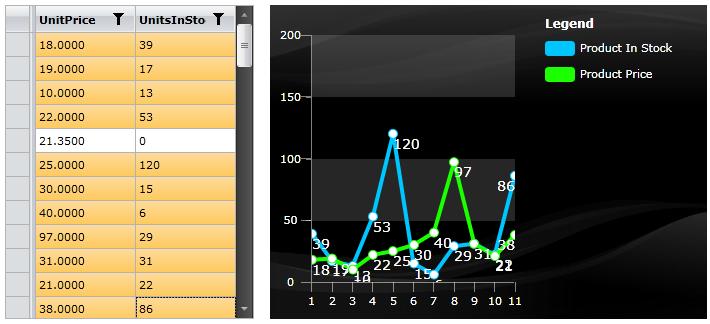
And when you select multiple rows: