Smart Labels
For charts that have many data points or data points with values close to one another, labels tend to collide making readability a problem. The Smart Labels feature automatically re-aligns labels making each labeled value stand out clearly. You are also able to configure the settings for the Smart Labels. This topic will explain how to:
Enable/Disable Smart Labels feature
The Smart Labels feature can be enabled/disabled through the SmartLabelsEnabled of the ChartArea property.
<telerik:RadChart x:Name="radChart">
    <telerik:RadChart.DefaultView>
        <telerik:ChartDefaultView>
            <telerik:ChartDefaultView.ChartArea>
                <telerik:ChartArea SmartLabelsEnabled="True" />
            </telerik:ChartDefaultView.ChartArea>
        </telerik:ChartDefaultView>
    </telerik:RadChart.DefaultView>
</telerik:RadChart>
this.radChart.DefaultView.ChartArea.SmartLabelsEnabled = true;
Me.radChart.DefaultView.ChartArea.SmartLabelsEnabled = True
Configure the Smart Labels feature
You are able to configure the setting of the Smart Labels feature by using the LabelSettings property of the series definitions. For the most series this property is of type LabelSettings. For the BarSeriesDefinition it is of type BarLabelSettings and for the PieSeriesDefinition and the DoughnutSeriesDefinition it is of type RadialLabelSettings.
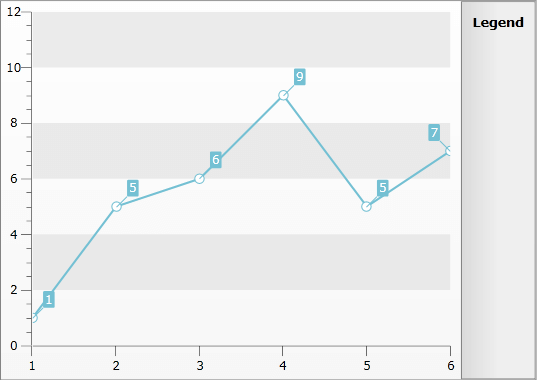
LabelSettings
The LabelSettings class is used for all of the RadChart series definitions except for the Bar, Pie and Doughnut series. It allows you to control the following:
Distance - the distance between the label and the respective point.
ShowConnectors - indicates whether lines should be visualized between the points and the labels.
<telerik:RadChart x:Name="radChart">
    <telerik:RadChart.DefaultSeriesDefinition>
        <telerik:LineSeriesDefinition>
            <telerik:LineSeriesDefinition.LabelSettings>
                <telerik:LabelSettings Distance="10" ShowConnectors="True" />
            </telerik:LineSeriesDefinition.LabelSettings>
        </telerik:LineSeriesDefinition>
    </telerik:RadChart.DefaultSeriesDefinition>
    <telerik:RadChart.DefaultView>
        <telerik:ChartDefaultView>
            <telerik:ChartDefaultView.ChartArea>
                <telerik:ChartArea SmartLabelsEnabled="True" />
            </telerik:ChartDefaultView.ChartArea>
        </telerik:ChartDefaultView>
    </telerik:RadChart.DefaultView>
</telerik:RadChart>
LabelSettings settings = new LabelSettings();
settings.Distance = 10;
settings.ShowConnectors = true;
LineSeriesDefinition lineSeries = new LineSeriesDefinition();
lineSeries.LabelSettings = settings;
this.radChart.DefaultSeriesDefinition = new LineSeriesDefinition();
this.radChart.DefaultView.ChartArea.SmartLabelsEnabled = true;
Dim settings As New LabelSettings()
settings.Distance = 10
settings.ShowConnectors = True
Dim lineSeries As New LineSeriesDefinition()
lineSeries.LabelSettings = settings
Me.radChart.DefaultSeriesDefinition = New LineSeriesDefinition()
Me.radChart.DefaultView.ChartArea.SmartLabelsEnabled = True

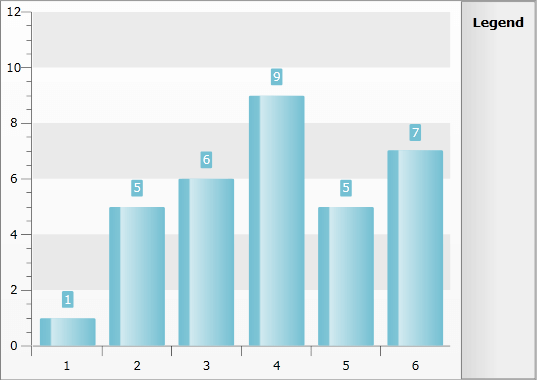
BarLabelSettings
The BarLabelSettings class inherits the LabelSettings class. The additional thing which it allows you to control is the LabelDisplayMode. It allows you to specify where to place the label relatively to the bar object. It can be set to one of the following values:
Auto - automatically chooses the bes position for the label.
Inside - the labels are placed inside the bar, near the top (or bottom for negative values).
MidPoint - the labels are placed in the middle of the bar.
Outside - the labels are placed over the bar (or below it for negative values).
<telerik:RadChart x:Name="radChart">
    <telerik:RadChart.DefaultSeriesDefinition>
        <telerik:BarSeriesDefinition>
            <telerik:BarSeriesDefinition.LabelSettings>
                <telerik:BarLabelSettings Distance="10"
                                          LabelDisplayMode="Outside"
                                          ShowConnectors="False" />
            </telerik:BarSeriesDefinition.LabelSettings>
        </telerik:BarSeriesDefinition>
    </telerik:RadChart.DefaultSeriesDefinition>
    <telerik:RadChart.DefaultView>
        <telerik:ChartDefaultView>
            <telerik:ChartDefaultView.ChartArea>
                <telerik:ChartArea SmartLabelsEnabled="True" />
            </telerik:ChartDefaultView.ChartArea>
        </telerik:ChartDefaultView>
    </telerik:RadChart.DefaultView>
</telerik:RadChart>
BarLabelSettings barSettings = new BarLabelSettings();
barSettings.Distance = 10;
barSettings.LabelDisplayMode = LabelDisplayMode.Outside;
barSettings.ShowConnectors = false;
BarSeriesDefinition barSeries = new BarSeriesDefinition();
barSeries.LabelSettings = barSettings;
this.radChart.DefaultSeriesDefinition = barSeries;
this.radChart.DefaultView.ChartArea.SmartLabelsEnabled = true;
Dim barSettings As New BarLabelSettings()
barSettings.Distance = 10
barSettings.LabelDisplayMode = LabelDisplayMode.Outside
barSettings.ShowConnectors = False
Dim barSeries As New BarSeriesDefinition()
barSeries.LabelSettings = barSettings
Me.radChart.DefaultSeriesDefinition = barSeries
Me.radChart.DefaultView.ChartArea.SmartLabelsEnabled = True

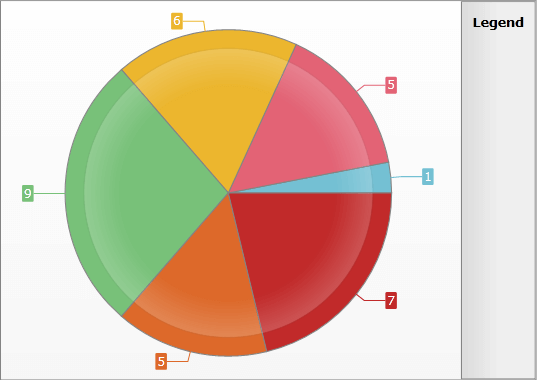
RadialLabelSettings
The RadialLabelSettings class inherits the LabelSettings class. In addition, it allows you to control the following:
LabelOffset - the position of the label relative to the Pie/Doughnut radius. Set it to 0.5 to place the label in the center of the slice. By setting it to a value of 2.0, the label will be placed at distance twice as the radius form the center.
SpirderModeEnabled - indicates whether the Spider mode is enabled or not. In this mode the labels are ordered around the Pie/Doughnut as spider legs. Combine it with ShowConnectors for a greater effect.
<telerik:RadChart x:Name="radChart">
    <telerik:RadChart.DefaultSeriesDefinition>
        <telerik:PieSeriesDefinition>
            <telerik:PieSeriesDefinition.LabelSettings>
                <telerik:RadialLabelSettings ShowConnectors="True" SpiderModeEnabled="True" />
            </telerik:PieSeriesDefinition.LabelSettings>
        </telerik:PieSeriesDefinition>
    </telerik:RadChart.DefaultSeriesDefinition>
    <telerik:RadChart.DefaultView>
        <telerik:ChartDefaultView>
            <telerik:ChartDefaultView.ChartArea>
                <telerik:ChartArea SmartLabelsEnabled="True" />
            </telerik:ChartDefaultView.ChartArea>
        </telerik:ChartDefaultView>
    </telerik:RadChart.DefaultView>
</telerik:RadChart>
RadialLabelSettings radialSettings = new RadialLabelSettings();
radialSettings.SpiderModeEnabled = true;
radialSettings.ShowConnectors = true;
PieSeriesDefinition pieSeries = new PieSeriesDefinition();
pieSeries.LabelSettings = radialSettings;
this.radChart.DefaultSeriesDefinition = pieSeries;
this.radChart.DefaultView.ChartArea.SmartLabelsEnabled = true;
Dim radialSettings As New RadialLabelSettings()
radialSettings.SpiderModeEnabled = True
radialSettings.ShowConnectors = True
Dim pieSeries As New PieSeriesDefinition()
pieSeries.LabelSettings = radialSettings
Me.radChart.DefaultSeriesDefinition = pieSeries
Me.radChart.DefaultView.ChartArea.SmartLabelsEnabled = True
Here is a snapshot of the result.
