Flattened Series
Sometimes when the grouping and aggregation get applied you might want to flatten it, in order to make it appear as one. This is done by combining all data points into one series and can be achieved by just setting the ShouldFlattenSeries property of the GroupingSettings class.
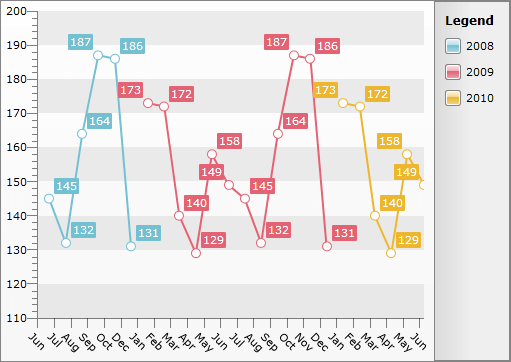
Here is a RadChart declaration before setting the ShouldFlattenSeries property to True.
To learn more about DateTime Grouping read here.
<telerik:RadChart x:Name="radChart">
    <telerik:RadChart.SeriesMappings>
        <telerik:SeriesMapping>
            <telerik:SeriesMapping.SeriesDefinition>
                <telerik:LineSeriesDefinition />
            </telerik:SeriesMapping.SeriesDefinition>
            <telerik:SeriesMapping.GroupingSettings>
                <telerik:GroupingSettings>
                    <telerik:GroupingSettings.GroupDescriptors>
                        <telerik:ChartYearGroupDescriptor Member="Date" />
                    </telerik:GroupingSettings.GroupDescriptors>
                </telerik:GroupingSettings>
            </telerik:SeriesMapping.GroupingSettings>
            <telerik:SeriesMapping.ItemMappings>
                <telerik:ItemMapping DataPointMember="XValue" FieldName="Date" />
                <telerik:ItemMapping DataPointMember="YValue" FieldName="Value" />
            </telerik:SeriesMapping.ItemMappings>
        </telerik:SeriesMapping>
    </telerik:RadChart.SeriesMappings>
</telerik:RadChart>

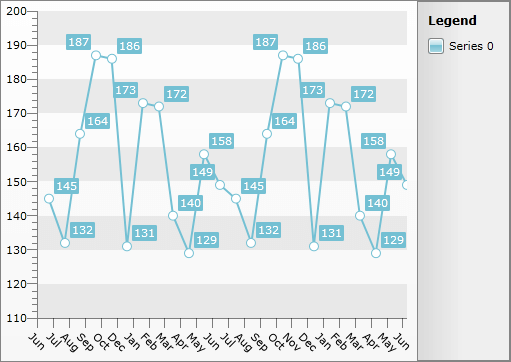
Here is the same RadChart after setting the property to True.
<telerik:SeriesMapping.GroupingSettings>
    <telerik:GroupingSettings ShouldFlattenSeries="True">
        <telerik:GroupingSettings.GroupDescriptors>
            <telerik:ChartYearGroupDescriptor Member="Date" />
        </telerik:GroupingSettings.GroupDescriptors>
    </telerik:GroupingSettings>
</telerik:SeriesMapping.GroupingSettings>
public Sample()
{
    InitializeComponent();
    this.radChart.SeriesMappings[ 0 ].GroupingSettings.ShouldFlattenSeries = true;
}
Public Sub New()
    InitializeComponent()
    Me.radChart.SeriesMappings(0).GroupingSettings.ShouldFlattenSeries = True
End Sub

Dynamic Series Flattening
If you want to allow the series to get flattened through the UI at run time, you have to change the ShouldFlattenSeries property. The change of the property will not cause the UI to update and to display the series according to it though. To apply the change you have to rebind the chart by calling its Rebind() method.
Here is an example of a CheckBox that manages the series flattening of the RadChart used above.
<CheckBox Click="CheckBox_Click" Content="Flatten" />
private void CheckBox_Click(object sender, RoutedEventArgs e)
{
    bool? isChecked = (sender as CheckBox).IsChecked;
    if (isChecked == null)
        return;
    this.radChart.SeriesMappings[0].GroupingSettings.ShouldFlattenSeries = (bool)isChecked;
    this.radChart.Rebind();
}
Private Sub CheckBox_Click(sender As Object, e As RoutedEventArgs)
    Dim isChecked As System.Nullable(Of Boolean) = TryCast(sender, CheckBox).IsChecked
    If isChecked Is Nothing Then
        Return
    End If
    Me.radChart.SeriesMappings(0).GroupingSettings.ShouldFlattenSeries = CBool(isChecked)
    Me.radChart.Rebind()
End Sub