CandlestickSeries
This is a typical financial series that can be used to visualize the state of a market for a period of time. The series operates with a special kind of data in the form of four parameters defining the stock market - open, high, low, and close. The high and low values show the price range (the highest and lowest prices) over one unit of time. The open and close values indicate the opening and closing price of the stock for the corresponding period. Candlestick series have body, which has a different color depending on the value of open and close prices of the financial data point. This kind of series require one CategoricalAxis and one LinearAxis.
Declaratively defined series
You can use the following definition to display a simple CandlestickSeries
Example 1: Declaring a CandlestickSeries in XAML
<telerik:RadCartesianChart Palette="Windows8">
<telerik:RadCartesianChart.HorizontalAxis>
<telerik:CategoricalAxis/>
</telerik:RadCartesianChart.HorizontalAxis>
<telerik:RadCartesianChart.VerticalAxis>
<telerik:LinearAxis />
</telerik:RadCartesianChart.VerticalAxis>
<telerik:RadCartesianChart.Series>
<telerik:CandlestickSeries>
<telerik:CandlestickSeries.DataPoints>
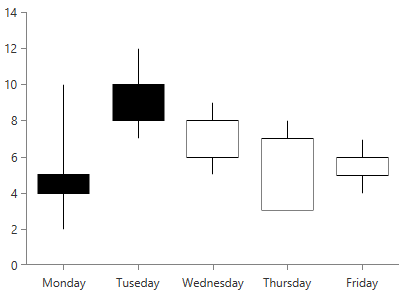
<telerik:OhlcDataPoint Category="Monday" Open="5" Close="4" Low="2" High="10" />
<telerik:OhlcDataPoint Category="Tuseday" Open="10" Close="8" Low="7" High="12"/>
<telerik:OhlcDataPoint Category="Wednesday" Open="6" Close="8" Low="5" High="9"/>
<telerik:OhlcDataPoint Category="Thursday" Open="3" Close="7" Low="3" High="8"/>
<telerik:OhlcDataPoint Category="Friday" Open="5" Close="6" Low="4" High="7"/>
</telerik:CandlestickSeries.DataPoints>
</telerik:CandlestickSeries>
</telerik:RadCartesianChart.Series>
</telerik:RadCartesianChart>
Figure 1: CandlestickSeries visual appearance
Properties
- CategoryBinding: A property of type DataPointBinding that gets or sets the property path that determines the category value of the data point.
- OpenBinding: A property of type DataPointBinding that gets or sets the property path that determines the open value of the ohlc data point.
- CloseBinding: A property of type DataPointBinding that gets or sets the property path that determines the close value of the ohlc data point.
- LowBinding: A property of type DataPointBinding that gets or sets the property path that determines the low value of the ohlc data point.
- HighBinding: A property of type DataPointBinding that gets or sets the property path that determines the high value of the ohlc data point.
Data Binding
You can use the CategoryBinding, OpenBinding, CloseBinding, LowBinding, HighBinding properties of the CandlestickSeries to bind the DataPoints’ properties to the properties from your view models.
Example 2: Defining the view model
public class PlotInfo
{
    public string Category { get; set; }
    public double Open { get; set; }
    public double Close { get; set; }
    public double Low { get; set; }
    public double High { get; set; }
}

//.......
this.DataContext = new ObservableCollection<PlotInfo>
{
    new PlotInfo() { Category = "January", Open = 5, Close = 4, Low = 2, High = 10},
    //....
};
Example 3: Specify a CandlestickSeries in XAML
<telerik:CandlestickSeries ItemsSource="{Binding}" CategoryBinding="Category" OpenBinding="Open" CloseBinding="Close" LowBinding="Low" HighBinding="High" />
See the Create Data-Bound Chart for more information on data binding in the RadChartView suite.
Styling the Series
You can see how to style the candlestick series using different properties, in the CandlestickSeries section of the Customizing CartesianChart Series help article.
Additionally, you can use the Palette property of the chart to change the colors of the CandlestickSeries on a global scale. You can find more information about this feature in the Palettes section in our help documentation.