TrackBall
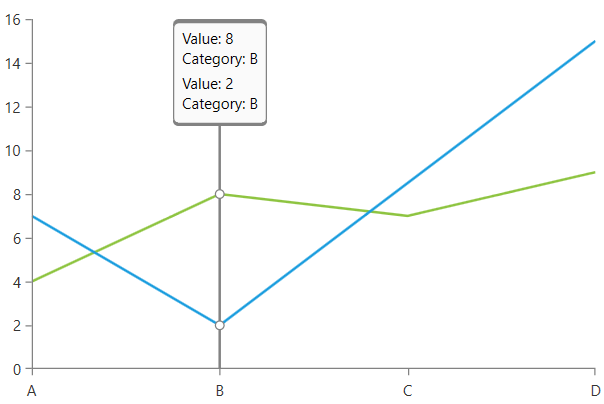
Along with tooltip and pan/zoom behaviors, RadChartView provides a trackball visualization through the ChartTrackBallBehavior class.
This behavior can display a vertical line across the chart plot area and little visual indicators (circles by default) at points where the trackball line crosses the visualization of a series object. For example, when the trackball line crosses a line series line segment, a small circle is drawn highlighting the value of the series at this point.
The behavior also displays a small popup (the trackball info), similar to the tooltip, in order to provide more detailed information about the points closest to the trackball line's cross section (see Figure 1).
Enable the TrackBall
To enable the trackball visualization, add a new ChartTrackBallBehavior instance in the Behaviors collection of the RadCartesianChart control.
Example 1: Enabling the trackball
<telerik:RadCartesianChart Palette="Windows8">
    <telerik:RadCartesianChart.Behaviors>
        <telerik:ChartTrackBallBehavior />
    </telerik:RadCartesianChart.Behaviors>

    <telerik:RadCartesianChart.VerticalAxis>
        <telerik:LinearAxis/>
    </telerik:RadCartesianChart.VerticalAxis>
    <telerik:RadCartesianChart.HorizontalAxis>
        <telerik:CategoricalAxis/>
    </telerik:RadCartesianChart.HorizontalAxis>
    <telerik:RadCartesianChart.Series>
        <telerik:LineSeries>
            <telerik:LineSeries.DataPoints>
                <telerik:CategoricalDataPoint Category="A" Value="4"/>
                <telerik:CategoricalDataPoint Category="B" Value="8"/>
                <telerik:CategoricalDataPoint Category="C" Value="7"/>
                <telerik:CategoricalDataPoint Category="D" Value="9"/>
            </telerik:LineSeries.DataPoints>
        </telerik:LineSeries>
        <telerik:LineSeries>
            <telerik:LineSeries.DataPoints>
                <telerik:CategoricalDataPoint Category="A" Value="7"/>
                <telerik:CategoricalDataPoint Category="B" Value="2"/>
                <telerik:CategoricalDataPoint Category="C" Value="18"/>
                <telerik:CategoricalDataPoint Category="D" Value="15"/>
            </telerik:LineSeries.DataPoints>
        </telerik:LineSeries>
    </telerik:RadCartesianChart.Series>
</telerik:RadCartesianChart>
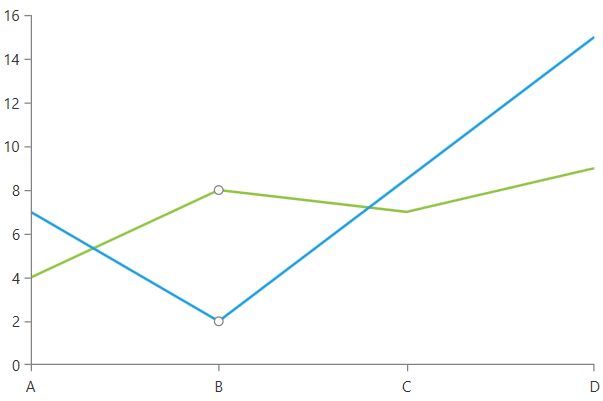
Figure 1: RadCartesianChart with trackball
By default the trackball shows the preview line that follows the data points closest to the mouse position and also the track info control (the information tooltip). The ellipses that snap to the data points are not displayed until explicitly enabled. Read more in the Toggle the TrackBall Visual Elements section of this article.
Snap Mode
The SnapMode property of ChartTrackBallBehavior determines how the trackball line will be snapped to the data points found by the trackball behavior. The property is enum accepting the following values:
-
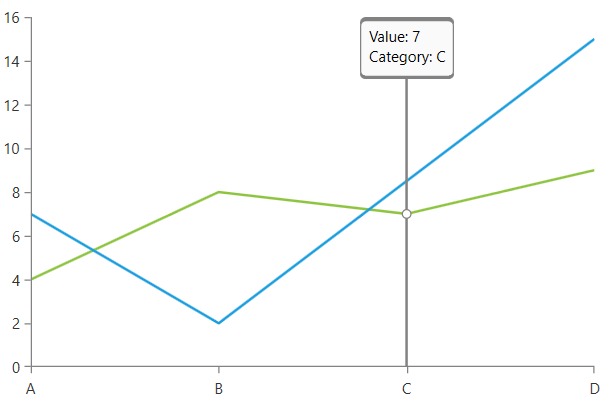
None: This mode disables the snapping of the line.
Figure 2: SnapMode: None
-
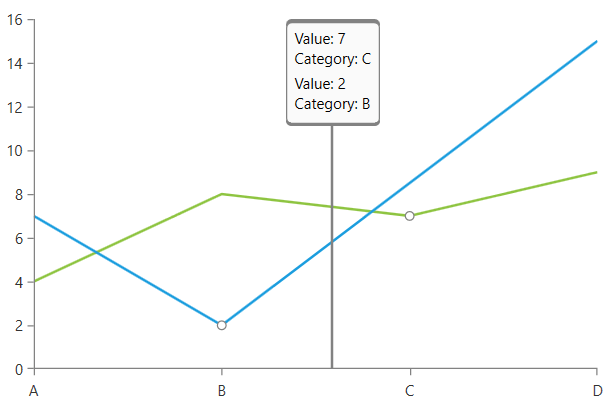
ClosestPoint (default): This mode snaps the trackball line to the closest point of all data points in the chart.
Figure 3: SnapMode: ClosestPoint
-
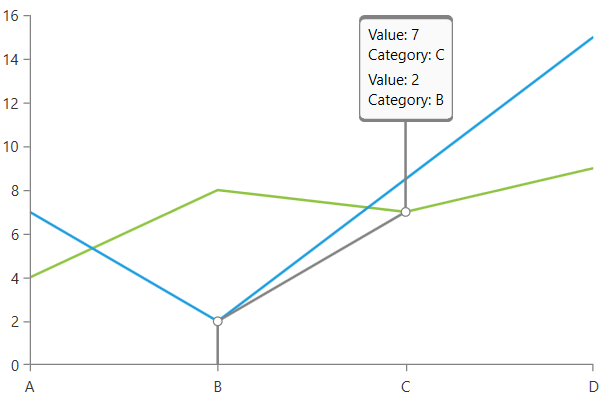
AllClosestPoints: This mode snaps the trackball line to the closest point from each series object in the chart.
Figure 4: SnapMode: AllClosestPoints
Example 2: Setting the SnapMode
<telerik:RadCartesianChart>
    <telerik:RadCartesianChart.Behaviors>
        <telerik:ChartTrackBallBehavior SnapMode="None"/>
    </telerik:RadCartesianChart.Behaviors>
</telerik:RadCartesianChart>
Snap Multiple Points Per Series
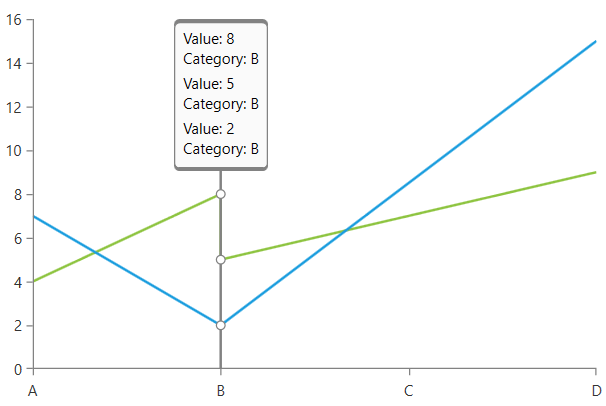
By default the trackball will display information only for a single data point per series. To change this set the SnapSinglePointPerSeries property to False. This way if you have multiple points in a single series, that are considered close to the mouse, all of them will be shown by the trackball.
Example 3: Setting the SnapSinglePointPerSeries property
<telerik:RadCartesianChart Palette="Windows8">
    <telerik:RadCartesianChart.Behaviors>
        <telerik:ChartTrackBallBehavior ShowIntersectionPoints="True" SnapSinglePointPerSeries="False" />
    </telerik:RadCartesianChart.Behaviors>

    <telerik:RadCartesianChart.VerticalAxis>
        <telerik:LinearAxis/>
    </telerik:RadCartesianChart.VerticalAxis>
    <telerik:RadCartesianChart.HorizontalAxis>
        <telerik:CategoricalAxis/>
    </telerik:RadCartesianChart.HorizontalAxis>
    <telerik:RadCartesianChart.Series>
        <telerik:LineSeries>
            <telerik:LineSeries.DataPoints>
                <telerik:CategoricalDataPoint Category="A" Value="4"/>
                <telerik:CategoricalDataPoint Category="B" Value="8"/>
                <telerik:CategoricalDataPoint Category="B" Value="5"/>
                <telerik:CategoricalDataPoint Category="C" Value="7"/>
                <telerik:CategoricalDataPoint Category="D" Value="9"/>
            </telerik:LineSeries.DataPoints>
        </telerik:LineSeries>
        <telerik:LineSeries>
            <telerik:LineSeries.DataPoints>
                <telerik:CategoricalDataPoint Category="A" Value="7"/>
                <telerik:CategoricalDataPoint Category="B" Value="2"/>
                <telerik:CategoricalDataPoint Category="D" Value="15"/>
            </telerik:LineSeries.DataPoints>
        </telerik:LineSeries>
    </telerik:RadCartesianChart.Series>
</telerik:RadCartesianChart>
Figure 5: Snap to multiple points series
Toggle the TrackBall Visual Elements
The trackball consists of three main visuals - line, info tooltip and intersection points. You can toggle their visibility via few properties.
To show/hide the info tooltip (the trackball info control), set the ShowTrackInfo property.
To show/hide the intersection points, set the ShowIntersectionPoints property.
To show/hide the line set its Visibility via the TrackBallLineStyle property of the RadCartesianChart.
Example 4: Toggle the trackball visuals
 <telerik:RadCartesianChart Palette="Windows8">
    <telerik:RadCartesianChart.TrackBallLineStyle>
        <Style TargetType="Polyline">
            <Setter Property="Visibility" Value="Collapsed" />
        </Style>
    </telerik:RadCartesianChart.TrackBallLineStyle>
    <telerik:RadCartesianChart.Behaviors>
        <telerik:ChartTrackBallBehavior ShowIntersectionPoints="True" ShowTrackInfo="False"/>
    </telerik:RadCartesianChart.Behaviors>

    <telerik:RadCartesianChart.VerticalAxis>
        <telerik:LinearAxis/>
    </telerik:RadCartesianChart.VerticalAxis>
    <telerik:RadCartesianChart.HorizontalAxis>
        <telerik:CategoricalAxis/>
    </telerik:RadCartesianChart.HorizontalAxis>
    <telerik:RadCartesianChart.Series>
        <telerik:LineSeries>
            <telerik:LineSeries.DataPoints>
                <telerik:CategoricalDataPoint Category="A" Value="4"/>
                <telerik:CategoricalDataPoint Category="B" Value="8"/>
                <telerik:CategoricalDataPoint Category="C" Value="7"/>
                <telerik:CategoricalDataPoint Category="D" Value="9"/>
            </telerik:LineSeries.DataPoints>
        </telerik:LineSeries>
        <telerik:LineSeries>
            <telerik:LineSeries.DataPoints>
                <telerik:CategoricalDataPoint Category="A" Value="7"/>
                <telerik:CategoricalDataPoint Category="B" Value="2"/>
                <telerik:CategoricalDataPoint Category="D" Value="15"/>
            </telerik:LineSeries.DataPoints>
        </telerik:LineSeries>
    </telerik:RadCartesianChart.Series>
</telerik:RadCartesianChart>
Figure 6: TrackBall with only intersection points shown
Customize the TrackBall Visual Elements
The chart provides several properties that allows customizing the trackball.
To customize the trackball line, set the TrackBallLineStyle property. The property accepts a Style object with its TargetType set to Polyline.
To customize the trackball info, set the TrackBallInfoStyle property. The property accepts a Style object with its TargetType set to TrackBallInfoControl.
Example 5: Setting the line and trackball info styles
<telerik:RadCartesianChart Palette="Windows8">
    <telerik:RadCartesianChart.TrackBallInfoStyle>
        <Style TargetType="telerik:TrackBallInfoControl">
            <Setter Property="Background" Value="Bisque" />
            <Setter Property="Header" Value="My Trackball Header" />
        </Style>
    </telerik:RadCartesianChart.TrackBallInfoStyle>
    <telerik:RadCartesianChart.TrackBallLineStyle>
        <Style TargetType="Polyline">
            <Setter Property="Stroke" Value="Red" />
        </Style>
    </telerik:RadCartesianChart.TrackBallLineStyle>
    <telerik:RadCartesianChart.Behaviors>
        <telerik:ChartTrackBallBehavior />
    </telerik:RadCartesianChart.Behaviors>

    <telerik:RadCartesianChart.VerticalAxis>
        <telerik:LinearAxis/>
    </telerik:RadCartesianChart.VerticalAxis>
    <telerik:RadCartesianChart.HorizontalAxis>
        <telerik:CategoricalAxis/>
    </telerik:RadCartesianChart.HorizontalAxis>
    <telerik:RadCartesianChart.Series>
        <telerik:LineSeries>
            <telerik:LineSeries.DataPoints>
                <telerik:CategoricalDataPoint Category="A" Value="4"/>
                <telerik:CategoricalDataPoint Category="B" Value="8"/>
                <telerik:CategoricalDataPoint Category="C" Value="7"/>
                <telerik:CategoricalDataPoint Category="D" Value="9"/>
            </telerik:LineSeries.DataPoints>
        </telerik:LineSeries>
        <telerik:LineSeries>
            <telerik:LineSeries.DataPoints>
                <telerik:CategoricalDataPoint Category="A" Value="7"/>
                <telerik:CategoricalDataPoint Category="B" Value="2"/>
                <telerik:CategoricalDataPoint Category="D" Value="15"/>
            </telerik:LineSeries.DataPoints>
        </telerik:LineSeries>
    </telerik:RadCartesianChart.Series>
</telerik:RadCartesianChart>
Figure 7: Customized line and trackball info

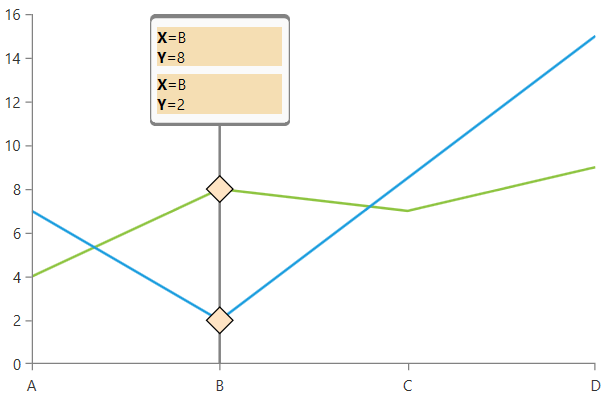
The trackball intersection points can be customized per series via the TrackBallTemplate property of the corresponding chart series.
Additionally, you can customize the information for each series via the TrackBallInfoTemplate property of the corresponding chart series.
Example 6: Setting the line and trackball templates
<telerik:RadCartesianChart Palette="Windows8">
    <telerik:RadCartesianChart.Resources>
        <DataTemplate x:Key="trackBallTemplate">
            <Rectangle Width="16" Height="16" Fill="Bisque" Stroke="Black" StrokeThickness="1">
                <Rectangle.LayoutTransform>
                    <RotateTransform Angle="45" />
                </Rectangle.LayoutTransform>
            </Rectangle>
        </DataTemplate>
        <DataTemplate x:Key="trackBallInfoTemplate">
            <StackPanel Background="Wheat" Margin="3" Width="100">
                <StackPanel Orientation="Horizontal">
                    <TextBlock Text="X=" FontWeight="Bold" />
                    <TextBlock Text="{Binding DataPoint.Category}" />
                </StackPanel>
                <StackPanel Orientation="Horizontal">
                    <TextBlock Text="Y=" FontWeight="Bold" />
                    <TextBlock Text="{Binding DataPoint.Value}" />
                </StackPanel>
            </StackPanel>
        </DataTemplate>
    </telerik:RadCartesianChart.Resources>
    <telerik:RadCartesianChart.Behaviors>
        <telerik:ChartTrackBallBehavior ShowIntersectionPoints="True" />
    </telerik:RadCartesianChart.Behaviors>
    <telerik:RadCartesianChart.VerticalAxis>
        <telerik:LinearAxis/>
    </telerik:RadCartesianChart.VerticalAxis>
    <telerik:RadCartesianChart.HorizontalAxis>
        <telerik:CategoricalAxis/>
    </telerik:RadCartesianChart.HorizontalAxis>
    <telerik:RadCartesianChart.Series>
        <telerik:LineSeries TrackBallTemplate="{StaticResource trackBallTemplate}"
                            TrackBallInfoTemplate="{StaticResource trackBallInfoTemplate}">
            <telerik:LineSeries.DataPoints>
                <telerik:CategoricalDataPoint Category="A" Value="4"/>
                <telerik:CategoricalDataPoint Category="B" Value="8"/>
                <telerik:CategoricalDataPoint Category="C" Value="7"/>
                <telerik:CategoricalDataPoint Category="D" Value="9"/>
            </telerik:LineSeries.DataPoints>
        </telerik:LineSeries>
        <telerik:LineSeries TrackBallTemplate="{StaticResource trackBallTemplate}"
                            TrackBallInfoTemplate="{StaticResource trackBallInfoTemplate}">
            <telerik:LineSeries.DataPoints>
                <telerik:CategoricalDataPoint Category="A" Value="7"/>
                <telerik:CategoricalDataPoint Category="B" Value="2"/>
                <telerik:CategoricalDataPoint Category="D" Value="15"/>
            </telerik:LineSeries.DataPoints>
        </telerik:LineSeries>
    </telerik:RadCartesianChart.Series>
</telerik:RadCartesianChart>
Figure 8: Customized line and trackball templates
Update the TrackBall Position
ChartTrackBallBehavior exposes a Position property that can be used to manually change the position of the trackball. The property accepts a value of type Sytem.Windows.Point. Setting the Position will display and snap the trackball to the data points that are plotted closest to the set position. The position is defined in pixels relative to the chart.
For example, if the chart is 500px wide and 300px high, and the Position property is set to new Point(250, 150) the trackball will be placed at the data points plotted closest to the 250th horizontal and 150th vertical pixels of the chart.
Example 7: Updating the trackball position
trackballBehavior.Position = new Point(250, 150);
trackballBehavior.Position = New Point(250, 150)
This behavior also provides the PositionChanging event, which is called on each change of the Position property. The event arguments expose a couple of helpful properties:
- PreviousPosition: Gets the previous position of the trackball.
- NewPosition: Gets or sets the new position of the trackball.
The PositionChanging event will be called only if the old and the new positions are different.
You can find a runnable project that demonstrates manipulating the position of the trackball in the TrackBallSyncedCharts SDK example.
Events
The behavior exposes the TrackInfoUpdated event that is useful if you want to modify the trackball info that is displayed in the tooltip. The TrackBallInfoEventArgs contain information about the data points near the mouse position.
Example 8: Subscribing to the TrackInfoUpdated event
<telerik:RadCartesianChart>
    <telerik:RadCartesianChart.Behaviors>
        <telerik:ChartTrackBallBehavior TrackInfoUpdated="ChartTrackBallBehavior_TrackInfoUpdated"/>
    </telerik:RadCartesianChart.Behaviors>
</telerik:RadCartesianChart>
Example 9: Canceling the trackball showing when the mouse is close to a specific category
private void ChartTrackBallBehavior_TrackInfoUpdated(object sender, Telerik.Windows.Controls.ChartView.TrackBallInfoEventArgs e)
{
    var closestDataPoint = (CategoricalDataPoint)e.Context.ClosestDataPoint.DataPoint;
    if (closestDataPoint.Category.Equals("C"))
    {
        e.Context.DataPointInfos.Clear();
    }
}
Private Sub ChartTrackBallBehavior_TrackInfoUpdated(ByVal sender As Object, ByVal e As Telerik.Windows.Controls.ChartView.TrackBallInfoEventArgs)
    Dim closestDataPoint = CType(e.Context.ClosestDataPoint.DataPoint, CategoricalDataPoint)

    If closestDataPoint.Category.Equals("C") Then
        e.Context.DataPointInfos.Clear()
    End If
End Sub